Fig. 14.
Download original image
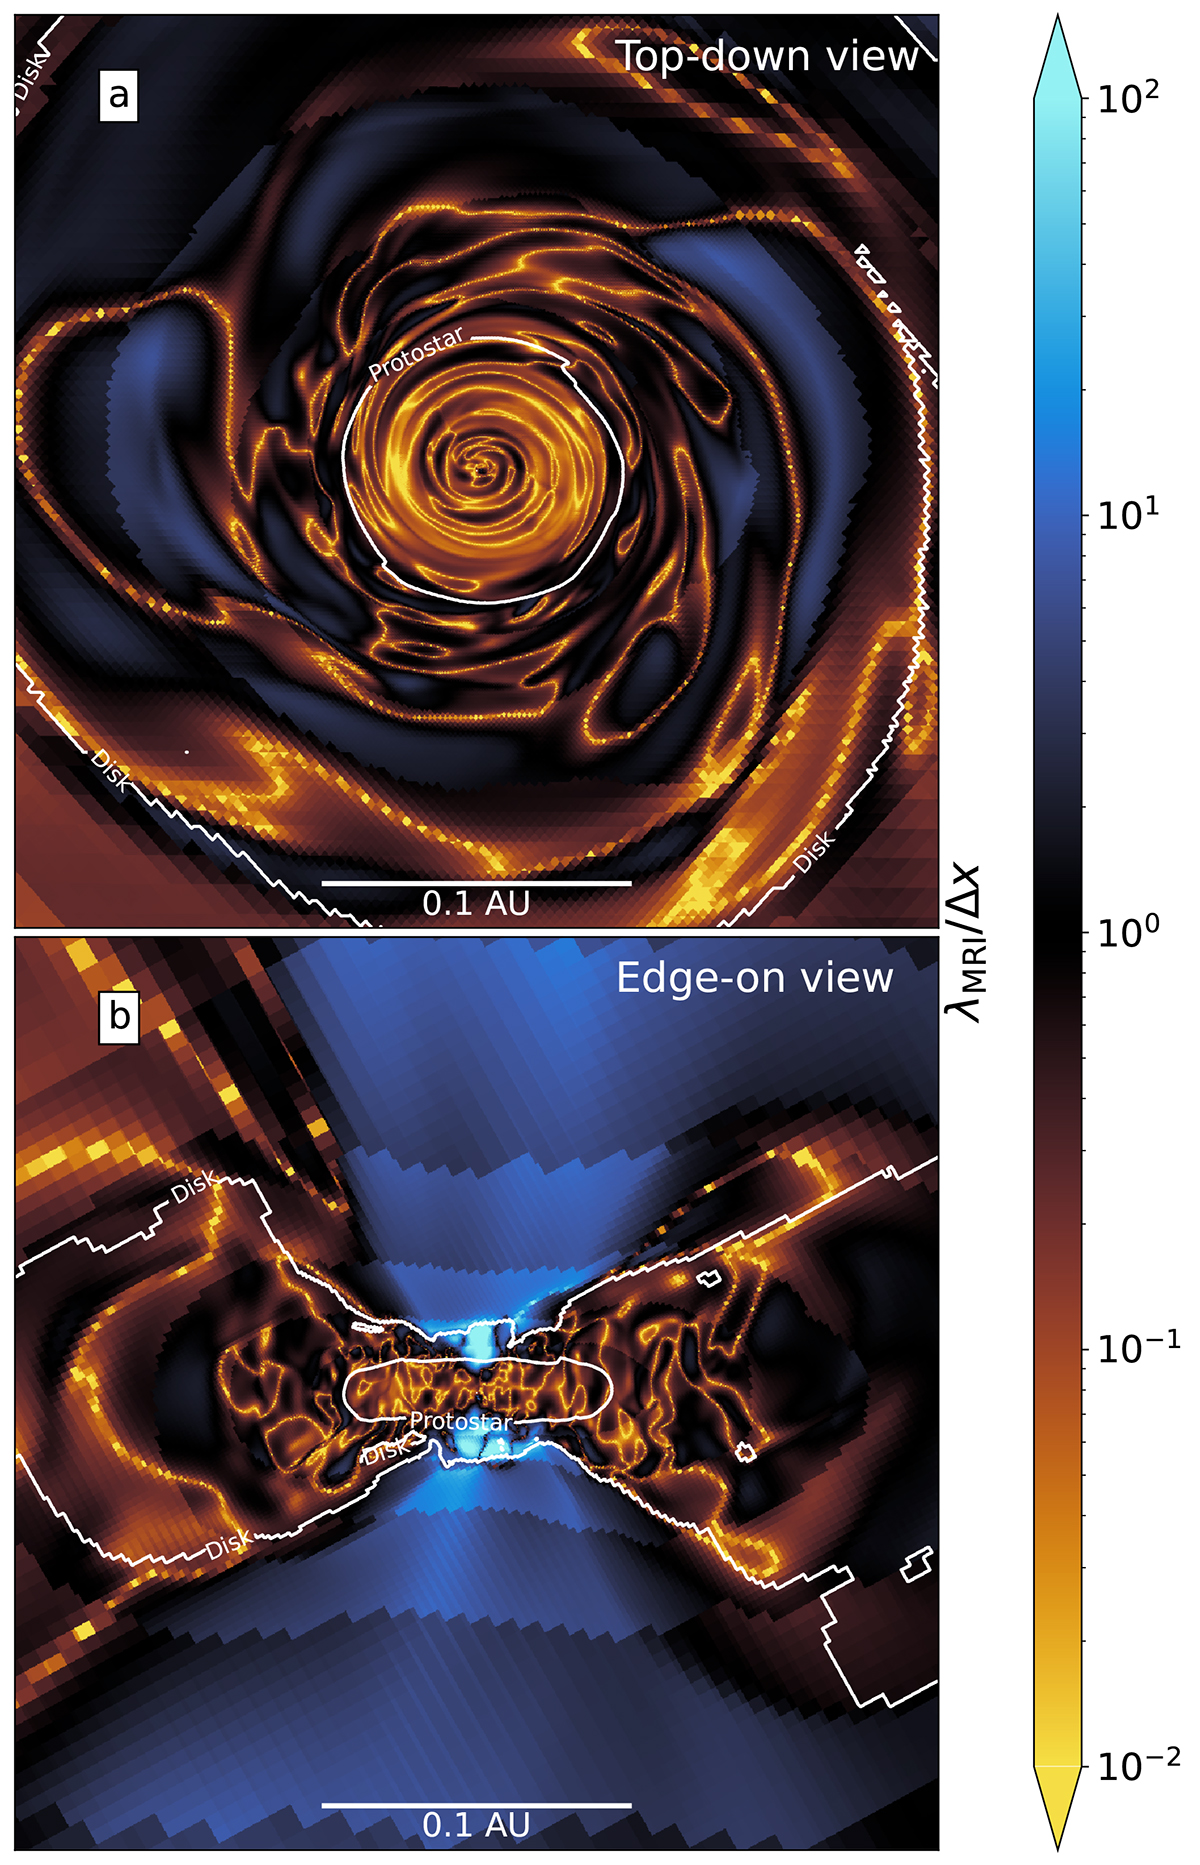
Top-down (panel a) and edge-on (panel b) slices across the star-disk system showing the ratio of the wavelength of the most unstable MRI mode to cell size at the final snapshot of run NIMHD (t ≈ 0.55 yr after protostellar birth). The outer contour corresponds to the disk surface, whereas the inner one corresponds to the protostar’s surface.
Current usage metrics show cumulative count of Article Views (full-text article views including HTML views, PDF and ePub downloads, according to the available data) and Abstracts Views on Vision4Press platform.
Data correspond to usage on the plateform after 2015. The current usage metrics is available 48-96 hours after online publication and is updated daily on week days.
Initial download of the metrics may take a while.