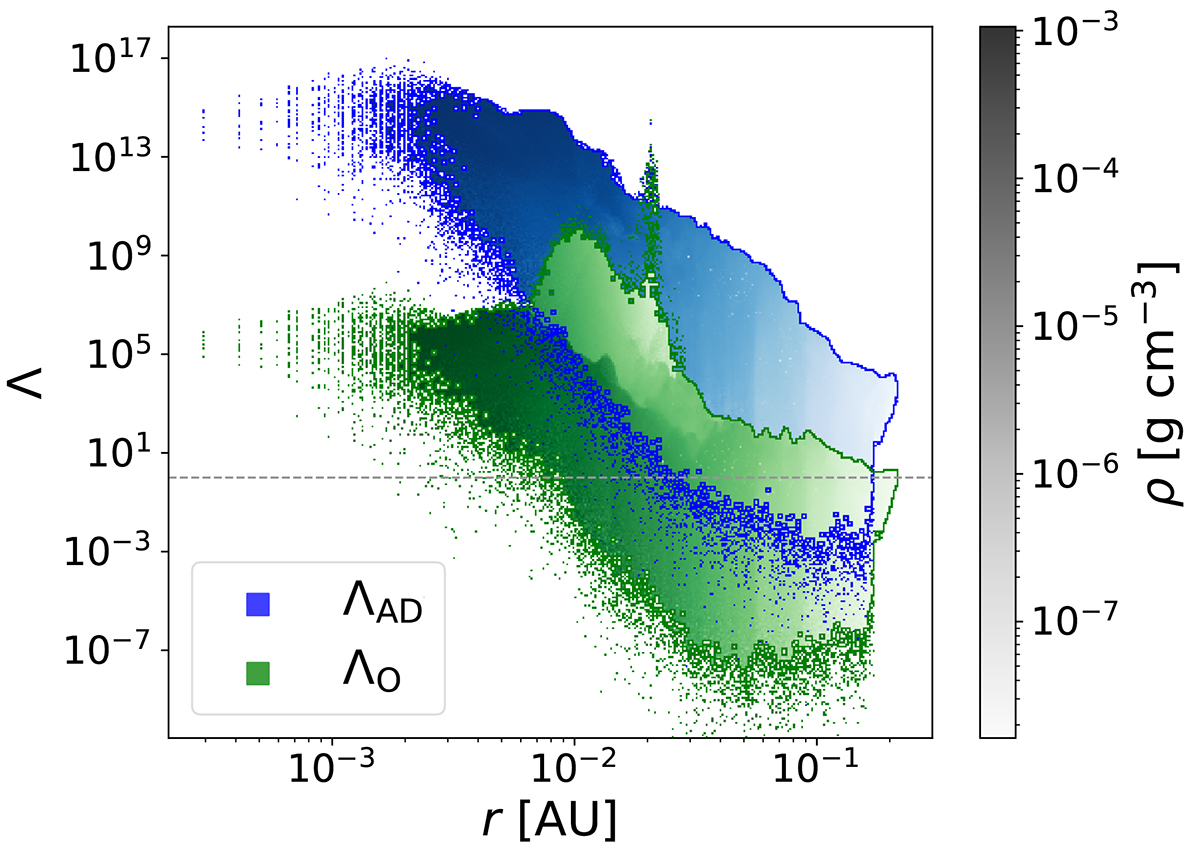
Fig. 12.
Download original image
Set of 2D histograms binning the cells belonging to the protostar and circumstellar disk (see Appendix A for an overview of each object’s definition) at the final simulation snapshot of run NIMHD (t ≈ 0.55 yr after protostellar birth). These display the ambipolar (ΛAD, blue distribution) and Ohmic (ΛO, green distribution) Elsässer numbers as a function of radius. The gray dotted line denotes Λ = 1. The color shading is related to the average density within the bin, as indicated by the grayscale colorbar.
Current usage metrics show cumulative count of Article Views (full-text article views including HTML views, PDF and ePub downloads, according to the available data) and Abstracts Views on Vision4Press platform.
Data correspond to usage on the plateform after 2015. The current usage metrics is available 48-96 hours after online publication and is updated daily on week days.
Initial download of the metrics may take a while.