Fig. 10.
Download original image
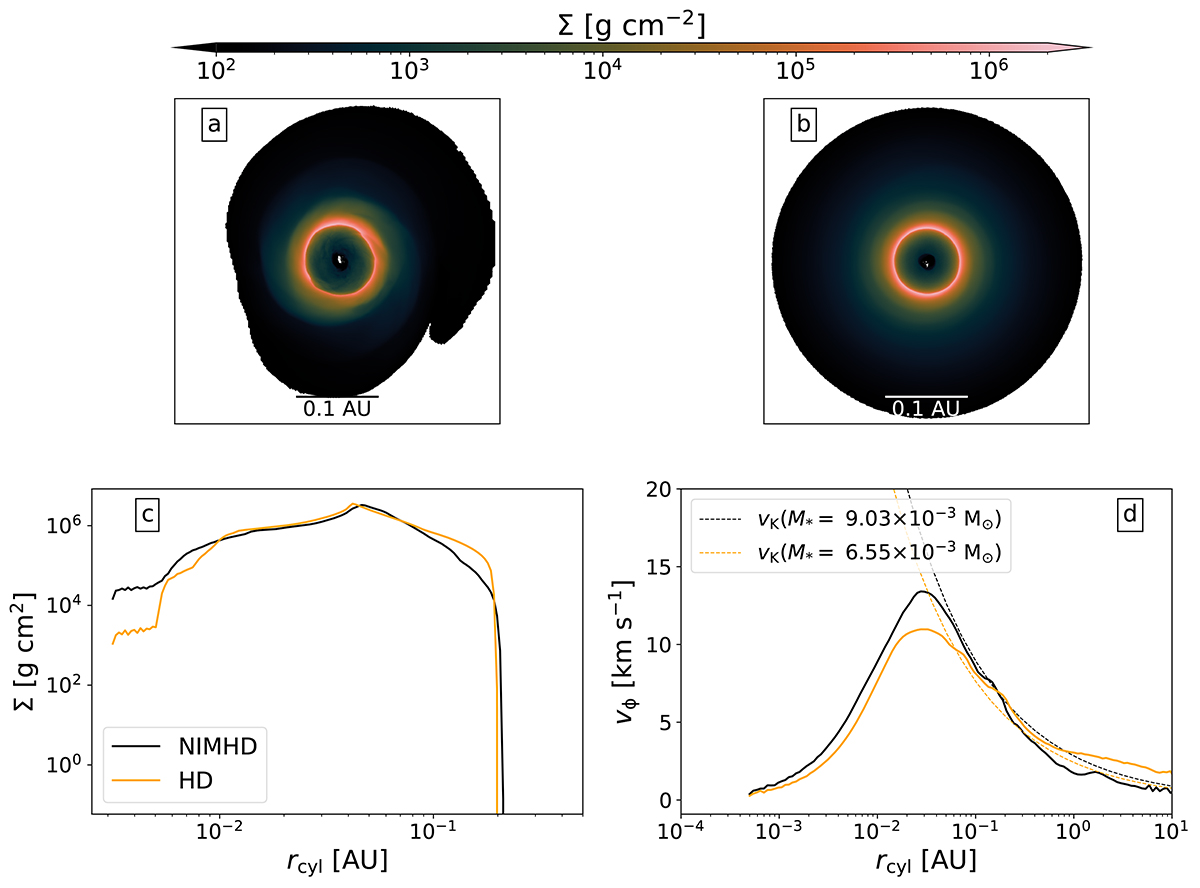
Structural and kinematic comparison between run NIMHD and HD (resp. black and orange curves in panels c and d). Panel (a) displays column density maps for run NIMHD at our final simulation snapshot, which is ≈190 days after protostellar birth. Panel (b) displays the equivalent map for run HD, at a moment in time where its radius is comparable to that of run NIMHD (≈0.2 AU). Only cells belonging to the disk were used in the making of these maps. The second row displays the radial profiles of column density (panel c) and azimuthal veocity (panel d). The dashed lines in panel (d) display the Keplerian velocity computed with the protostar’s mass.
Current usage metrics show cumulative count of Article Views (full-text article views including HTML views, PDF and ePub downloads, according to the available data) and Abstracts Views on Vision4Press platform.
Data correspond to usage on the plateform after 2015. The current usage metrics is available 48-96 hours after online publication and is updated daily on week days.
Initial download of the metrics may take a while.