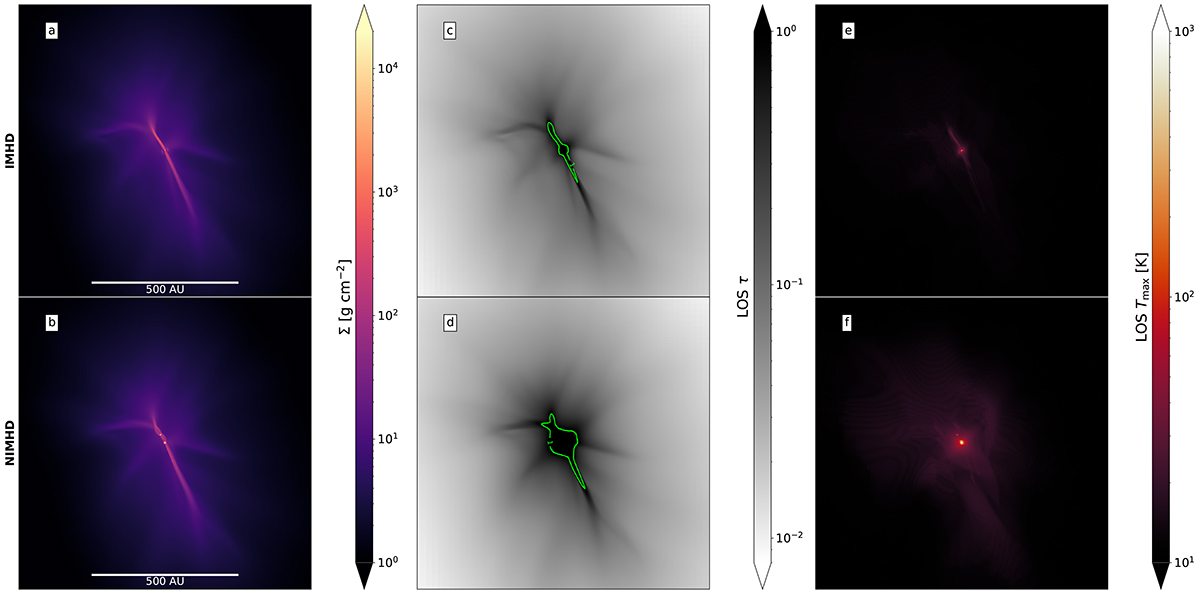
Fig. 1.
Download original image
Comparison of runs IMHD (first row) and NIMHD (second row) at the scale of the dense cloud core itself. The snapshots are taken respectively at t ≈ 23.25 and t ≈ 23.39 kyr following the collapse of the dense core. The first column displays column density (panels a and b), the second column displays the optical depth computed along the line of sight (panels c and d), and the last column displays the maximum temperature along the line of sight (panels e and f). All maps are projections along the z-axis. The green contour in panels (c) and (d) represent an optical depth of unity. The scale bars in the first column apply to the other columns as well.
Current usage metrics show cumulative count of Article Views (full-text article views including HTML views, PDF and ePub downloads, according to the available data) and Abstracts Views on Vision4Press platform.
Data correspond to usage on the plateform after 2015. The current usage metrics is available 48-96 hours after online publication and is updated daily on week days.
Initial download of the metrics may take a while.