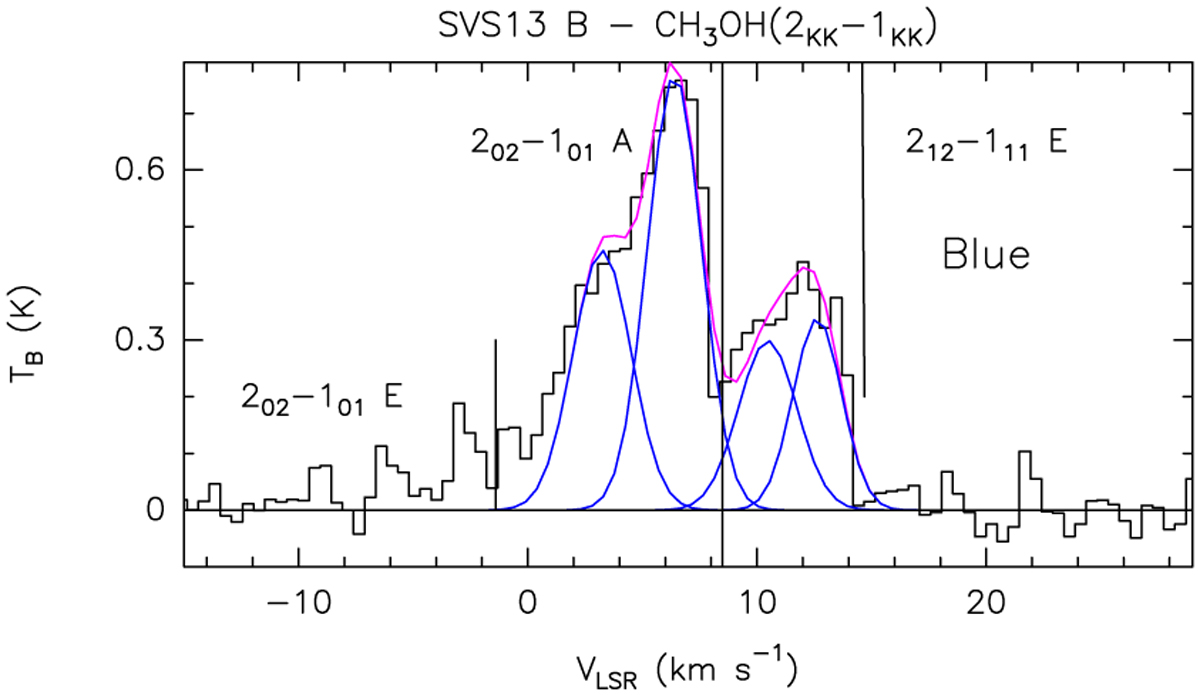
Fig. B.1
Download original image
CH3OH(2kk−1kk) spectrum (in brightness temperature, TB, scale) extracted at the blue-shifted emission peak position (see Sect. 5.3). The transitions producing the methanol profile are labelled, with the corresponding frequencies marked by vertical black segments (see Table 1). The CH3OH spectrum is centred at the frequency of the 20,2−10,1 A transition: 96741.38 MHz. The black vertical line at +8.5 km s−1 is for the systemic velocity (Podio et al. 2021). The 20,2−10,1 A and 21,2−11,1 E lines have been fit (magenta contour) by assuming for each line two Gaussian components with a FWHM of 3 km s−1 shifted by −2.0 km s−1, and −5.3 km s−1, respectively (in blue).
Current usage metrics show cumulative count of Article Views (full-text article views including HTML views, PDF and ePub downloads, according to the available data) and Abstracts Views on Vision4Press platform.
Data correspond to usage on the plateform after 2015. The current usage metrics is available 48-96 hours after online publication and is updated daily on week days.
Initial download of the metrics may take a while.