Fig. A.1
Download original image
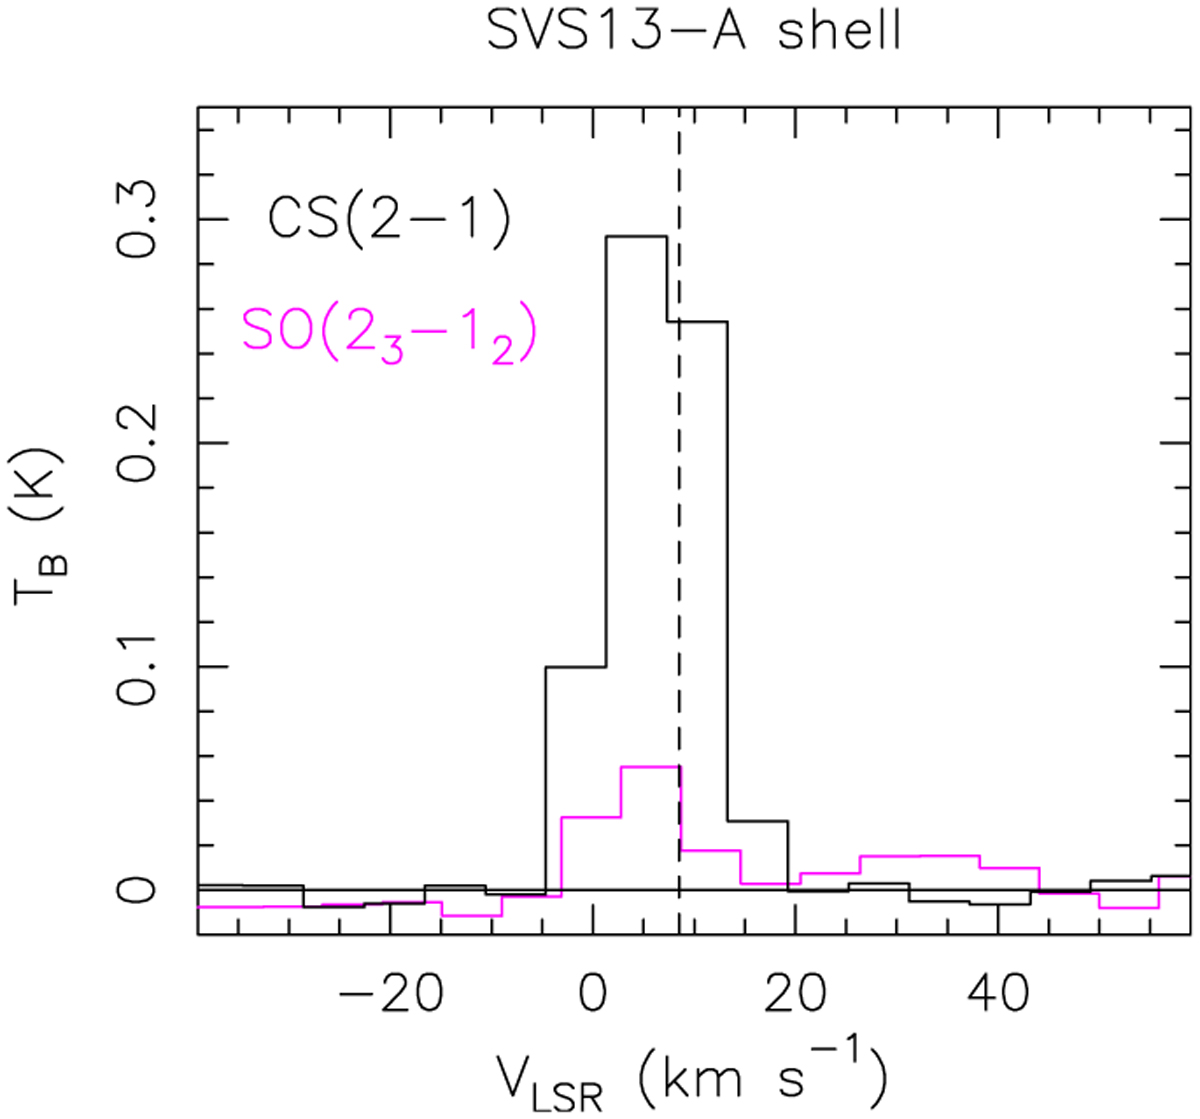
Line profiles in CS(2–1), and SO(23−12), in brightness temperature scale, towards the peak of the CS emission in the SVS13-A southern molecular shell: α(J2000) = 03h 29m 05s.317, δ(J2000) = +31∘ 15′30″.09. The black vertical line at +8.5 km s−1 is for the systemic emissions. The CS lines is brighter than the SO one, although a word of caution is needed given the position lies outside the FoV of the images.
Current usage metrics show cumulative count of Article Views (full-text article views including HTML views, PDF and ePub downloads, according to the available data) and Abstracts Views on Vision4Press platform.
Data correspond to usage on the plateform after 2015. The current usage metrics is available 48-96 hours after online publication and is updated daily on week days.
Initial download of the metrics may take a while.