Fig. 7
Download original image
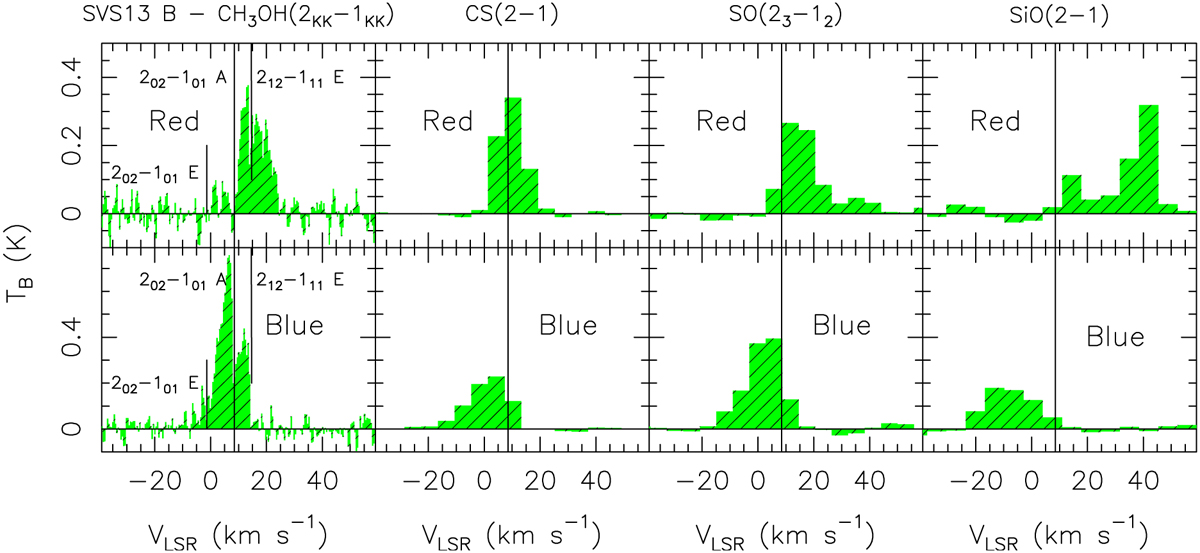
From left to right: spectra in brightness temperature (TB scale) of CH3OH(2kk−1kk), CS(2-1), SO(23−12), and SiO(2–1) extracted at the positions of the emission peaks along the red- (top panels) and blue-shifted (bottom panels) lobes (see the red and blue crosses in Fig. 6). For SiO, the dataset with the beam of 2″.56 × 2″ 14 was used (see Table 1). The transitions producing the emission methanol profiles are labelled, and the corresponding frequencies are marked by vertical black segments (see Table 1). The CH3OH spectra are centred at the frequency of the 20,2−10,1 A transition: 96741.38 MHz. The vertical black lines at +8.5 km s−1 indicate the systemic velocity (Podio et al. 2021).
Current usage metrics show cumulative count of Article Views (full-text article views including HTML views, PDF and ePub downloads, according to the available data) and Abstracts Views on Vision4Press platform.
Data correspond to usage on the plateform after 2015. The current usage metrics is available 48-96 hours after online publication and is updated daily on week days.
Initial download of the metrics may take a while.