Fig. 6
Download original image
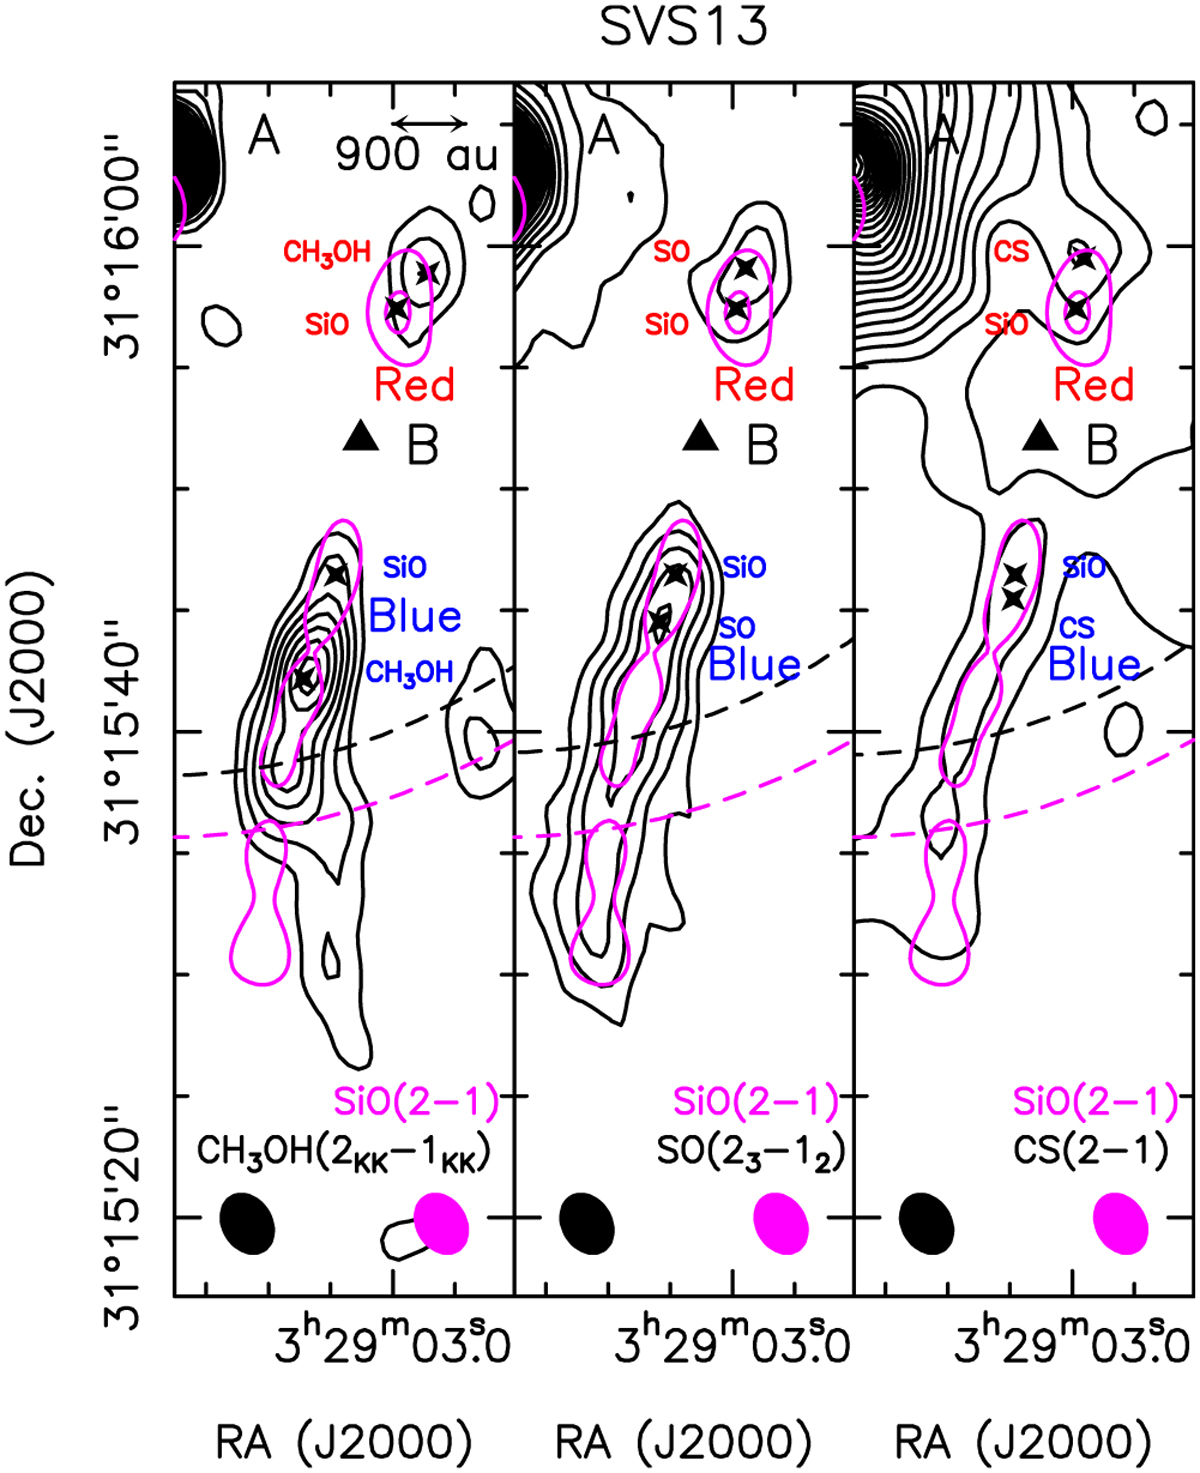
Red- and blue-shifted bipolar SVS13-B jet as traced by SiO(2–1) is shown in magenta and is compared with CH3OH(2kk−1kk) (left panel), SO(23−12) (middle panel), and CS(2–1) (right panel). The methanol emission is due to the lines of the 2kk−1kk spectral pattern that emits at 96.7 GHz (see Table 1). The SiO and SO maps were obtained by integrating on the following velocity ranges with respect to the systemic velocity (+8.5 km s−1; Podio et al. 2021): ± 33.8 km s−1 (SiO), ± 23.6 km s−1 (SO), and from −18.3 km s−1 to +6.1 km s−1 (CS) (see Fig. 3). The first contours and steps are at 3σ, which corresponds to 72 mJy km s−1 beam−1(SiO), 45 mJy km s−1 beam−1(CH3OH), and 63 mJy km s−1 beam−1 (SO, and CS). The positions of the B continuum peak are marked by a black triangle (Table 2). The crosses mark for each species the peaks of the red- and blue-shifted emission (see labels). The synthesised beams are shown in the bottom-left corners, and the dashed circles delimitate the FoV (Table 1). For SiO, the dataset with the beam of 2″.56 × 2″.14 was used for a proper comparison with SO, CS, and CH3OH.
Current usage metrics show cumulative count of Article Views (full-text article views including HTML views, PDF and ePub downloads, according to the available data) and Abstracts Views on Vision4Press platform.
Data correspond to usage on the plateform after 2015. The current usage metrics is available 48-96 hours after online publication and is updated daily on week days.
Initial download of the metrics may take a while.