Fig. 5
Download original image
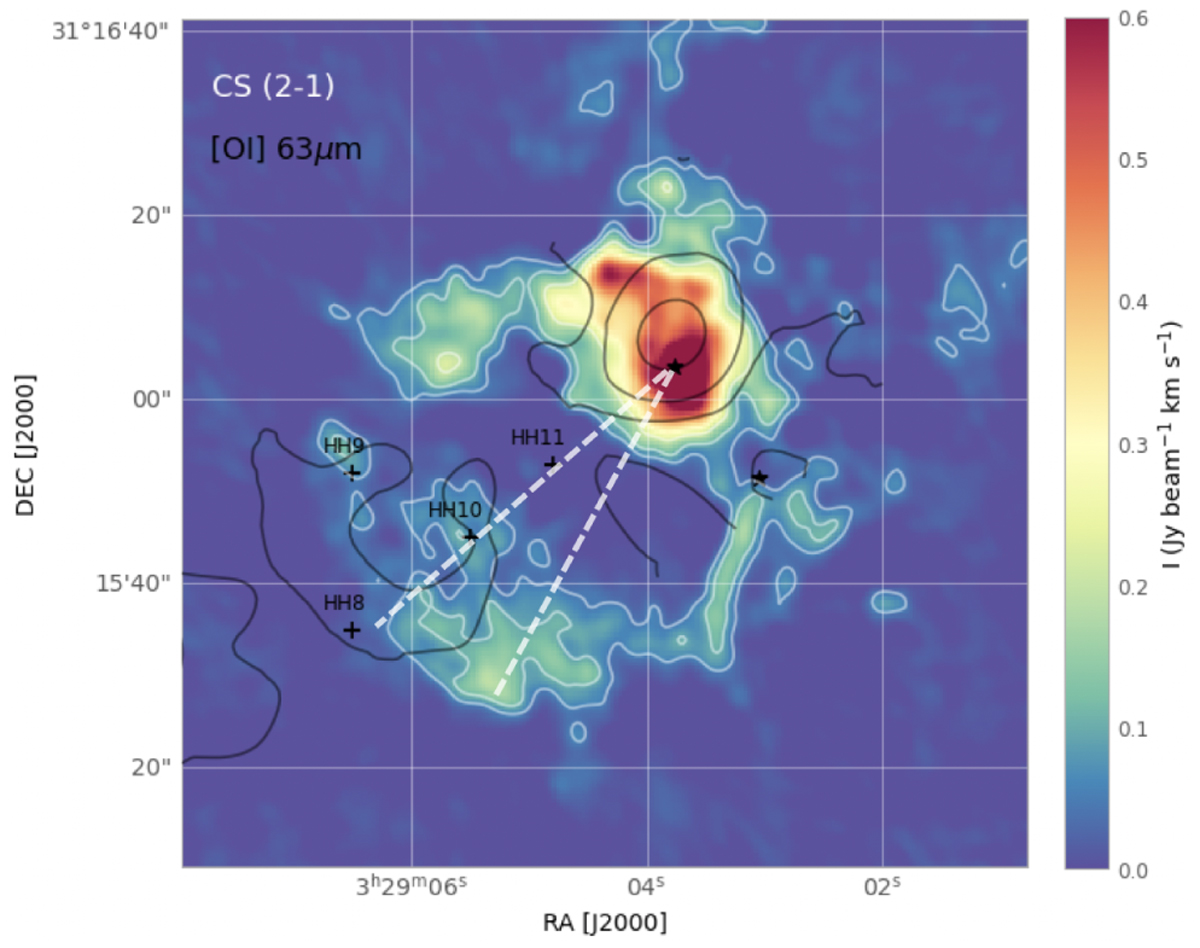
SVS13 protostellar cluster: Comparison of our CS(2–1) NOEMA-SOLIS map (colour scale and white contours) and the spatial distribution of the [OI] gas observed at 63 μm with SOFIA (black contours; some contours are not closed due to the FoV of the SOFIA observations). The contours correspond to three levels between (0.068–0.400) × 10−13 erg s−1 cm−2, as in Figure 5 by Sperling et al. (2020). The FWHM beam size of the SOFIA observations is 5″.4. The dashed lines indicate the direction of the two main jets: (i) PA ≃ 130ˆ (connecting SVS13-A and HH11) and (ii) PA ∼ 155ˆ (traced by H2, and CO bullets; see text).
Current usage metrics show cumulative count of Article Views (full-text article views including HTML views, PDF and ePub downloads, according to the available data) and Abstracts Views on Vision4Press platform.
Data correspond to usage on the plateform after 2015. The current usage metrics is available 48-96 hours after online publication and is updated daily on week days.
Initial download of the metrics may take a while.