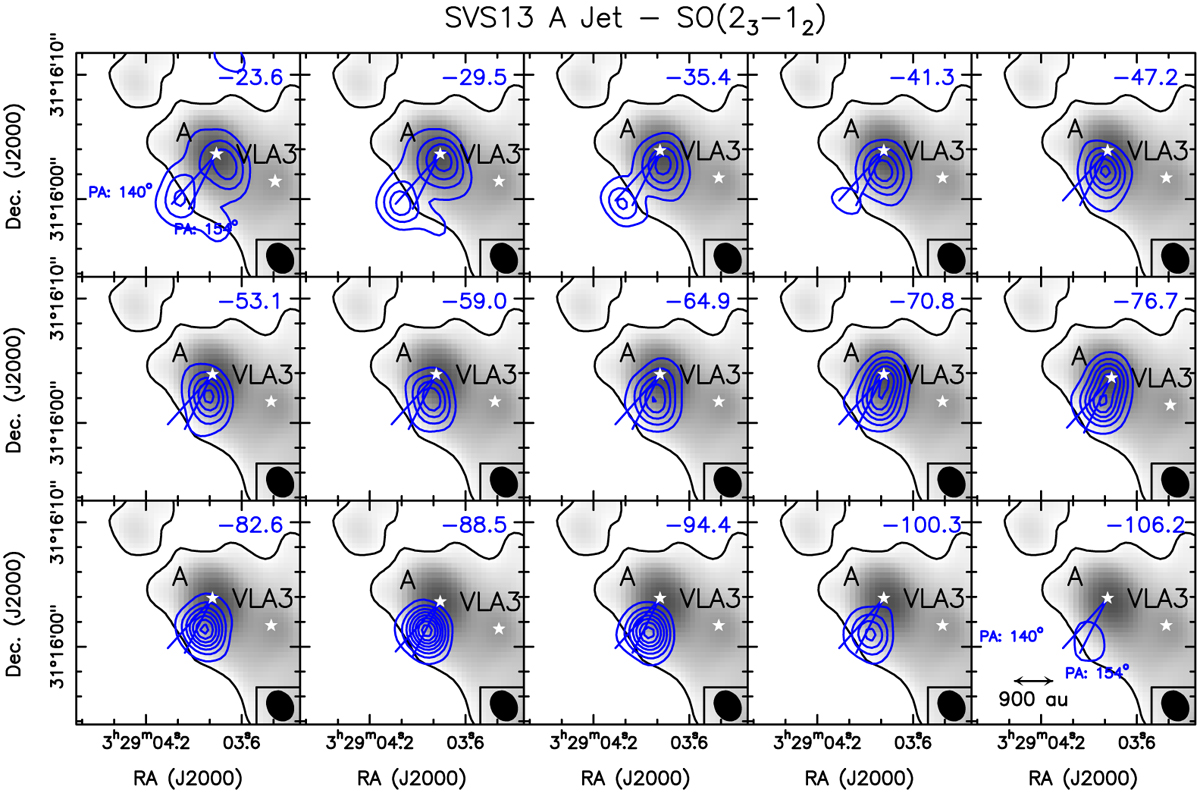
Fig. D.2
Download original image
Channel maps of the SO(23−12) blue-shifted emission towards SVS13-A. Each panel shows the emission shifted in velocity with respect to the systemic velocity (+8.5 km s−1, Podio et al. 2021) by the value given in the upper right corner. The positions of SVS13-A and VLA3 continuum peaks are marked by white stars, the beam is in the bottom-right corner. In grey scale (and black contour) the 3 mm continuum image is shown (Fig. 1). First contours and steps are 3σ (21 mJy beam−1). The pair of blue lines delineates the jet’s trajectory, as marked by the slowest (∼−24 km s−1, PA = ∼140∘) and the fastest (∼−106 km s−1, PA ∼154∘) velocities.
Current usage metrics show cumulative count of Article Views (full-text article views including HTML views, PDF and ePub downloads, according to the available data) and Abstracts Views on Vision4Press platform.
Data correspond to usage on the plateform after 2015. The current usage metrics is available 48-96 hours after online publication and is updated daily on week days.
Initial download of the metrics may take a while.