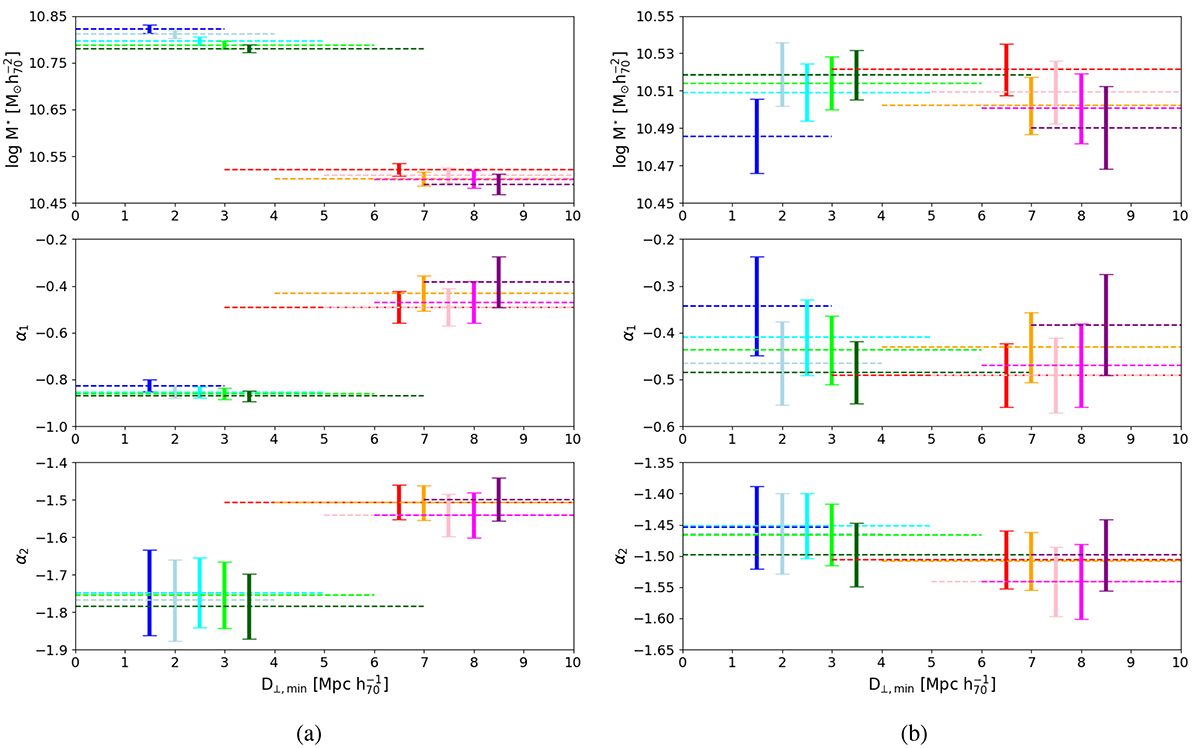
Fig. 9.
Download original image
Best-fit double Schechter function parameters of the cGSMFs shown in Fig. 8 using the same colour-coding by filament radius. The differences between filaments and voids found for M⋆, α1, and α2 when using the entire galaxy sample in panel (a) vanish after removing all grouped galaxies from the filament samples in panel (b). We note the different scaling of the y-axes in (a) and (b).
Current usage metrics show cumulative count of Article Views (full-text article views including HTML views, PDF and ePub downloads, according to the available data) and Abstracts Views on Vision4Press platform.
Data correspond to usage on the plateform after 2015. The current usage metrics is available 48-96 hours after online publication and is updated daily on week days.
Initial download of the metrics may take a while.