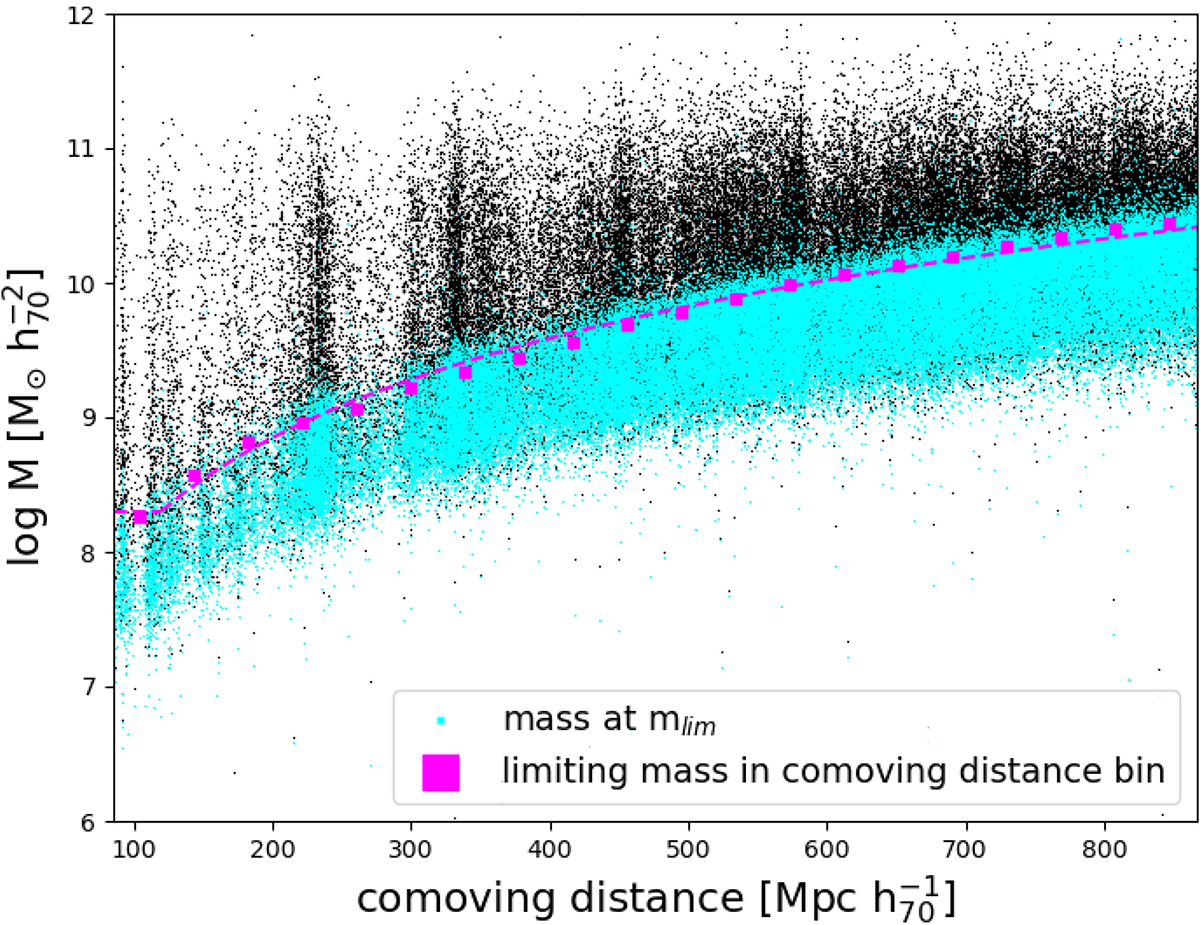
Fig. 7.
Download original image
Determination of the stellar mass completeness limit as a function of comoving distance for our galaxy sample (black dots). Due to the range in M/Lr, constraining the mass completeness limit of a flux limited sample is not straightforward. By keeping the M/Lr and the redshift of each source constant, we determined the stellar mass that each object would have if its flux was equal to the flux limit. These limiting mass values are shown in cyan, with higher dots at a given redshift having larger M/Lr values. We then divided our sample into bins of comoving distance, sorted the sources in each bin according to their luminosity, selected the faintest 20%, and determined the stellar mass below which 95% of these faint objects lie (Pozzetti et al. 2010). We repeated this procedure for each bin and thus obtained the limiting mass values that are shown as magenta squares. The mass completeness function Mlim(d), shown as the magenta dashed line, was then estimated by fitting an exponential curve to these limiting mass value in each comoving distance bin.
Current usage metrics show cumulative count of Article Views (full-text article views including HTML views, PDF and ePub downloads, according to the available data) and Abstracts Views on Vision4Press platform.
Data correspond to usage on the plateform after 2015. The current usage metrics is available 48-96 hours after online publication and is updated daily on week days.
Initial download of the metrics may take a while.