Fig. 6.
Download original image
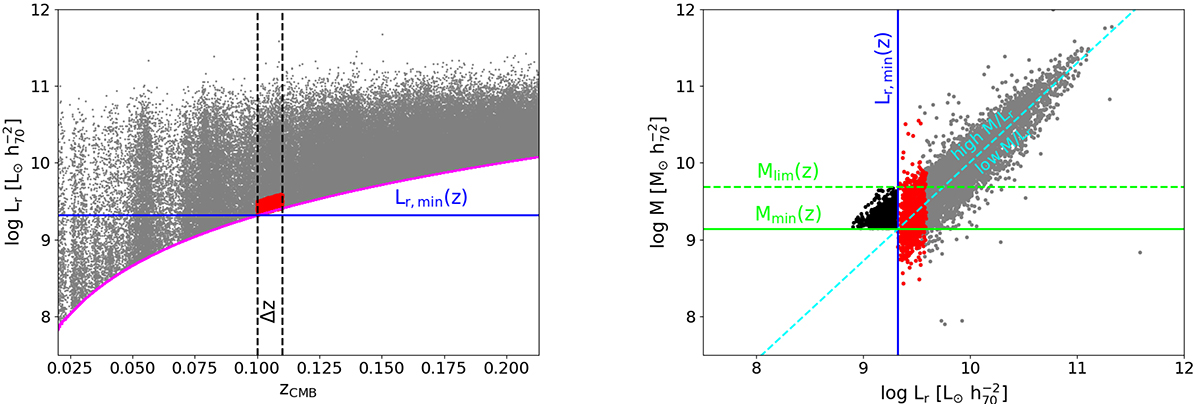
Left-hand panel: Distribution of the total r-band luminosity as a function of redshift for our parent galaxy sample (grey dots). The magenta curve represents our selection function and gives the lowest luminosity of a galaxy for which a redshift could have been collected in GAMA, given our apparent magnitude limit of r = 19.8 mag. The two dashed black lines define a narrow redshift range Δz for illustrative purposes. The solid blue line and the red box correspond to the luminosity limit and the 20% faintest galaxies associated with this redshift range, respectively. Right-hand panel: Stellar mass versus r-band luminosity for the galaxy subsample in the narrow redshift range, Δz, defined in the left-hand panel. The dashed cyan line gives the average correlation between the two galactic properties. Galaxies lying above this line have a higher than average M/Lr and vice versa. The luminosity limit from the left-hand panel is also shown here in blue. The intersection of this limit with the average correlation defines the corresponding mass limit at this redshift shown as a solid green line. However, this mass limit would not in fact result in a complete sample as all galaxies to the left of the blue line, shown in black, would be missed. To be complete, it is necessary to move the mass limit up sufficiently such that (almost) no more galaxies are missed. The dashed green line thus gives the final stellar mass limit, representing the 95% M/Lr completeness limit of the 20% faintest galaxies at this redshift (see text).
Current usage metrics show cumulative count of Article Views (full-text article views including HTML views, PDF and ePub downloads, according to the available data) and Abstracts Views on Vision4Press platform.
Data correspond to usage on the plateform after 2015. The current usage metrics is available 48-96 hours after online publication and is updated daily on week days.
Initial download of the metrics may take a while.