Open Access
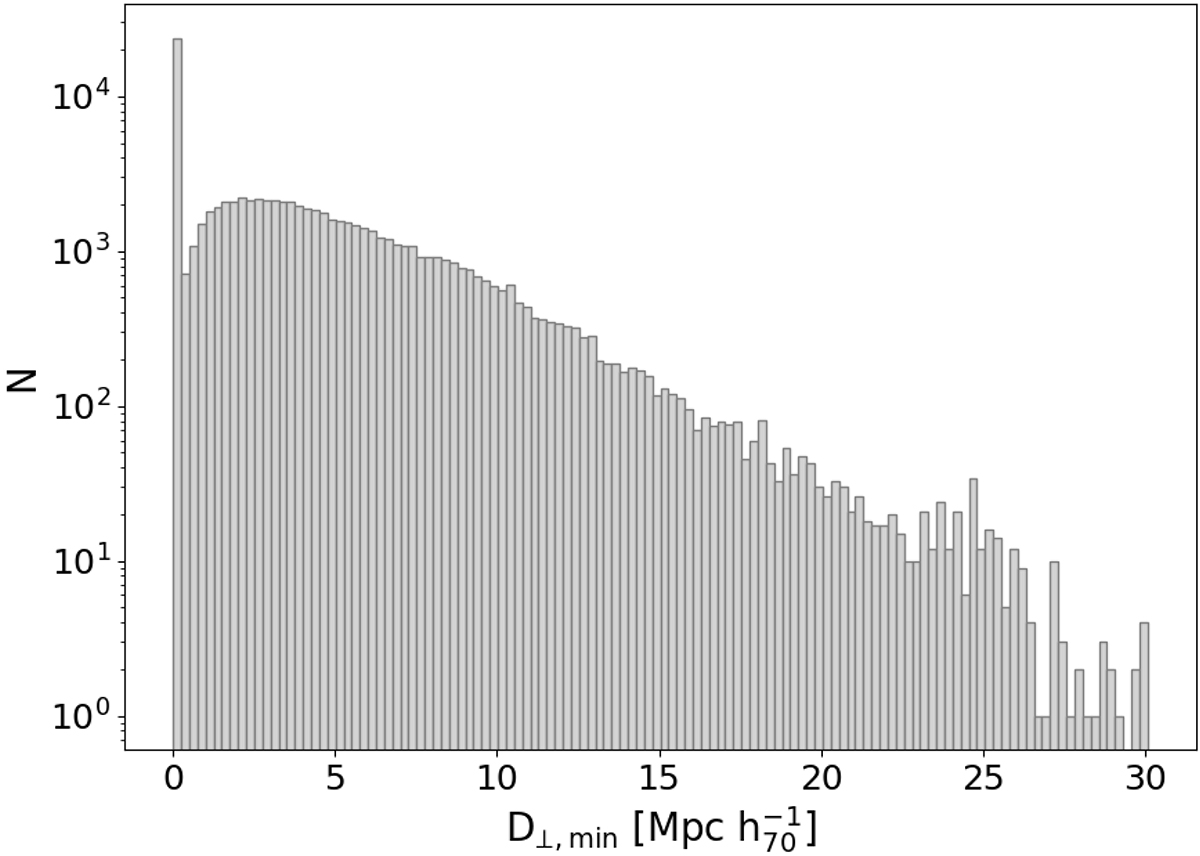
Fig. 4.
Download original image
Distribution of the orthogonal distance of a galaxy to its nearest filament. The galaxies in subsample G1 (galaxies in groups that are part of a filament) are responsible for the bump at 0 Mpc since they are assigned a value of D⊥,min = 0 Mpc by definition.
Current usage metrics show cumulative count of Article Views (full-text article views including HTML views, PDF and ePub downloads, according to the available data) and Abstracts Views on Vision4Press platform.
Data correspond to usage on the plateform after 2015. The current usage metrics is available 48-96 hours after online publication and is updated daily on week days.
Initial download of the metrics may take a while.