Fig. 2.
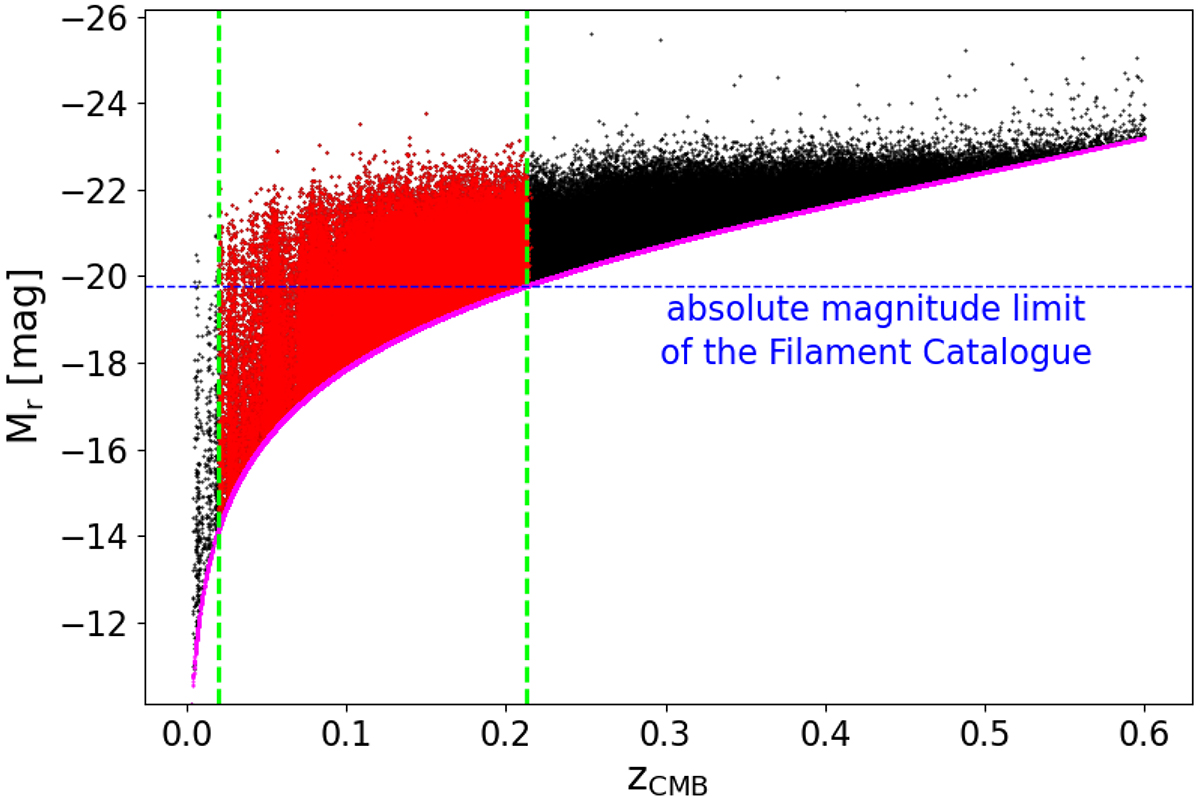
Download original image
Distribution of the absolute r-band magnitude as a function of redshift for all the galaxies in G3CGalv08 (black points). The magenta curve represents our selection function and gives the faintest possible galaxy that is visible in GAMA at each redshift, given our apparent magnitude limit of r = 19.8 mag. Red points show our parent galaxy sample after our initial selection criteria were applied. The two dashed green lines determine our redshift limits (see Sect. 3.1.2 for a discussion of the lower redshift cut). The dashed blue line shows the absolute magnitude cut applied by Alpaslan et al. (2014).
Current usage metrics show cumulative count of Article Views (full-text article views including HTML views, PDF and ePub downloads, according to the available data) and Abstracts Views on Vision4Press platform.
Data correspond to usage on the plateform after 2015. The current usage metrics is available 48-96 hours after online publication and is updated daily on week days.
Initial download of the metrics may take a while.