Fig. 1.
Download original image
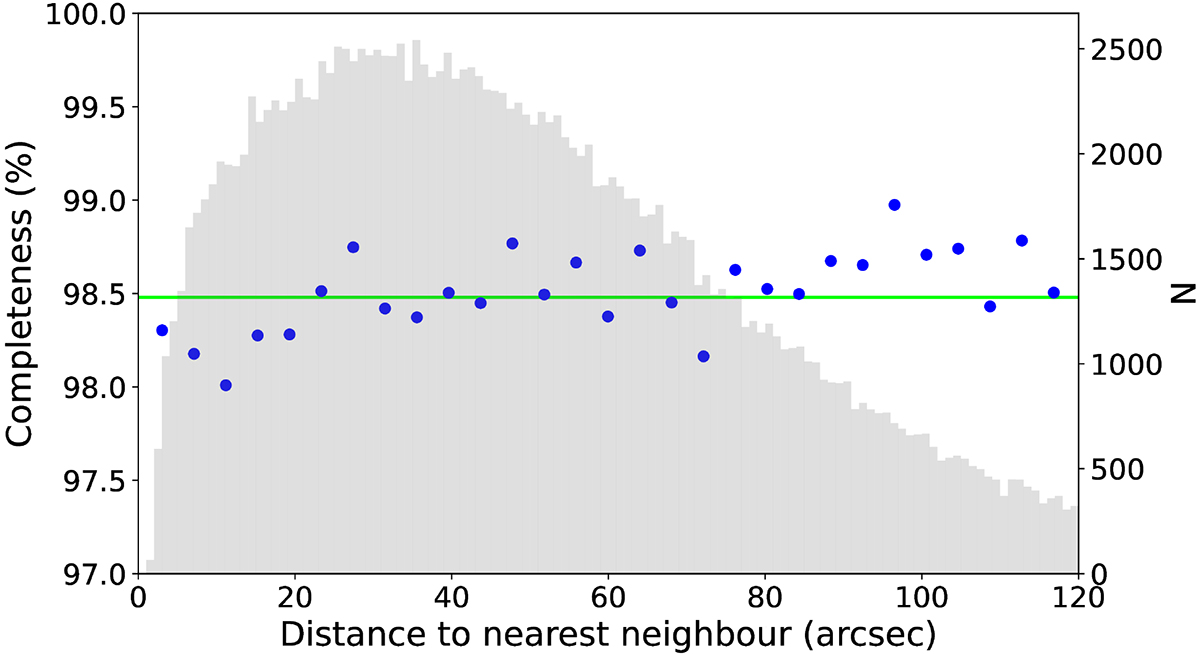
Redshift completeness of the three equatorial GAMA regions G09, G12, and G15 as a function of the distance to the nearest neighbour among main survey targets (blue dots). As in Liske et al. (2015), the horizontal green line and the grey shaded histogram show the overall average redshift completeness and the distribution of all nearest neighbour distances, respectively.
Current usage metrics show cumulative count of Article Views (full-text article views including HTML views, PDF and ePub downloads, according to the available data) and Abstracts Views on Vision4Press platform.
Data correspond to usage on the plateform after 2015. The current usage metrics is available 48-96 hours after online publication and is updated daily on week days.
Initial download of the metrics may take a while.