Fig. B.1
Download original image
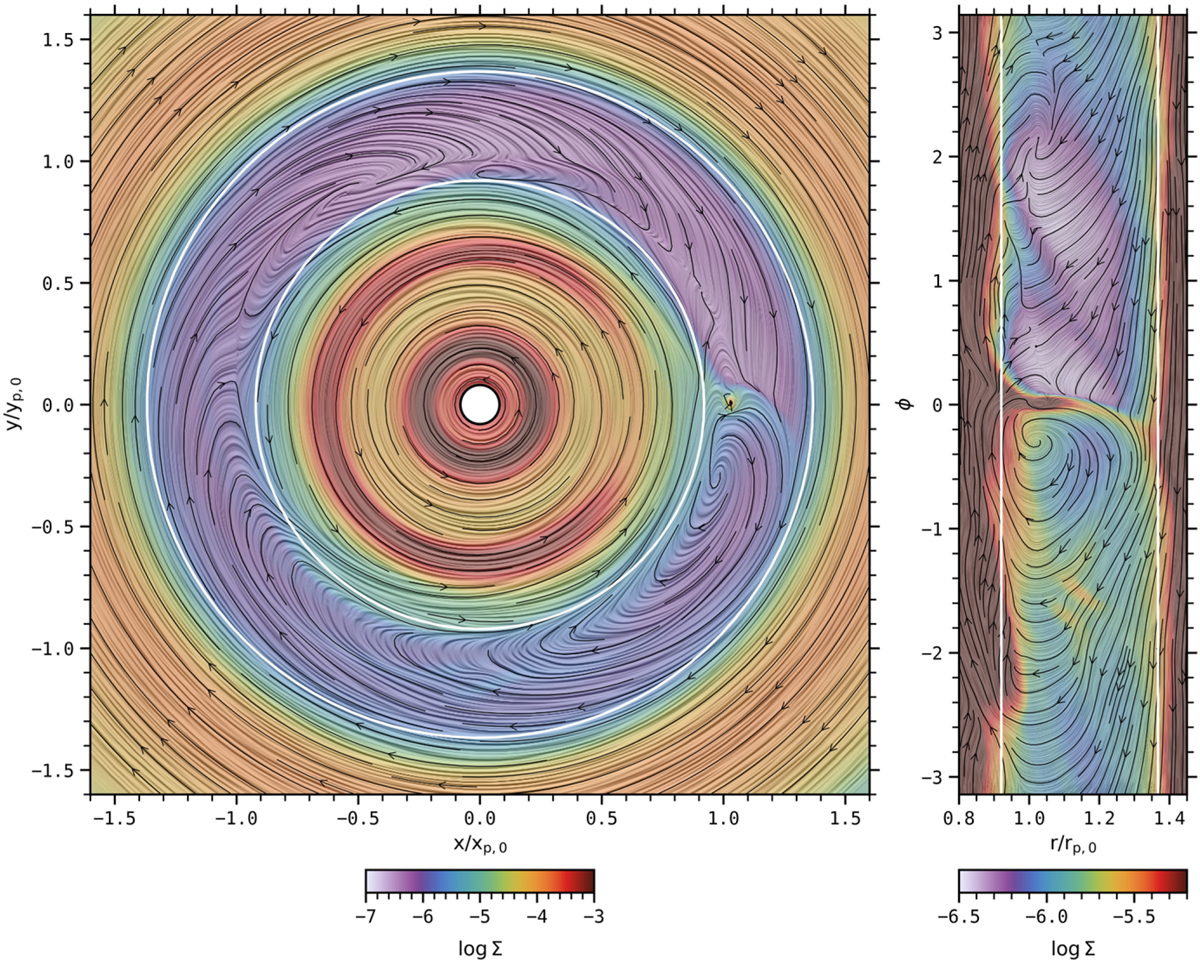
Gas flows around the planet for the run ℳ300 at t = 490.75 orbits. The background color represents the logarithm of the gas surface density. The black streamlines and the LIC (Line Integral Convolution) correspond to the radial and azimuthal components of the horizontal velocity, in the midplane and in the planet’s reference frame. The white lines indicate the estimated inner and outer gap edge. The right panel focuses on the horseshoe region.
Current usage metrics show cumulative count of Article Views (full-text article views including HTML views, PDF and ePub downloads, according to the available data) and Abstracts Views on Vision4Press platform.
Data correspond to usage on the plateform after 2015. The current usage metrics is available 48-96 hours after online publication and is updated daily on week days.
Initial download of the metrics may take a while.