Fig. 4
Download original image
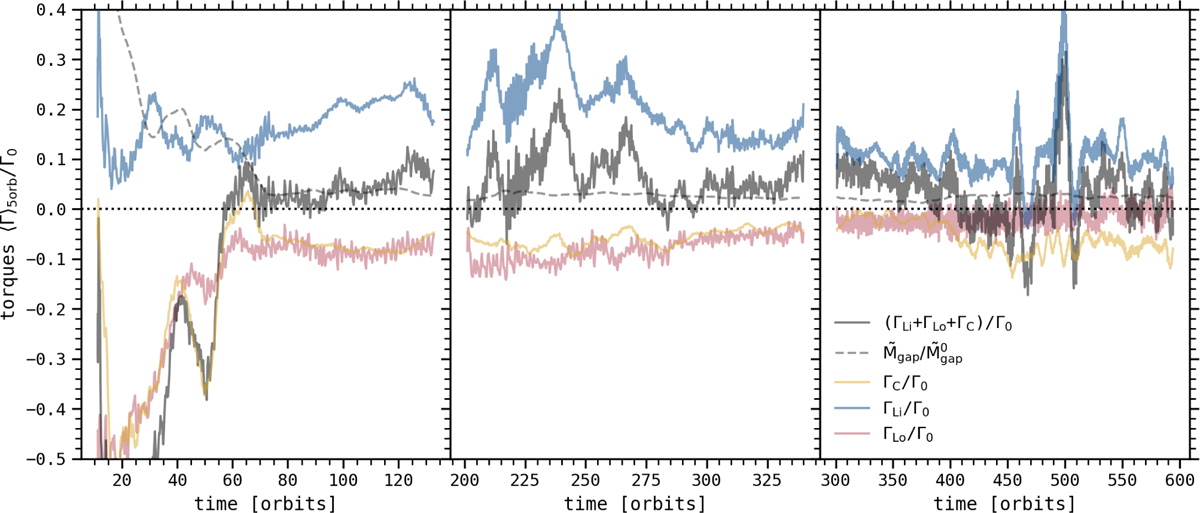
Temporal evolution of various torque components exerted by the gas on the migrating planet and displayed with a moving average of 5 orbits, for the three runs ℳ10 (left panel), ℳ200 (middle panel), and ℳ300 (right panel). The total torque (black solid curves) is decomposed in three components, coming from different regions: the torque from the inner disk associated to the inner Lindblad torque 〈ΓLi 〉5orb (blue curves, 〈ΓLi 〉5orb ≳ 0), the torque from the outer disk associated to the outer Lindblad torque 〈ΓLo 〉5orb (red curves, 〈ΓLo 〉5orb ≲ 0), and the torque in the planet gap associated to the corotation torque 〈ΓC〉5orb (yellow curves, 〈ΓC〉5orb ≲ 0). All these torques are normalized by Γ0 . A proxy for the mass reservoir enclosed in the gap is represented via the black dashed line.
Current usage metrics show cumulative count of Article Views (full-text article views including HTML views, PDF and ePub downloads, according to the available data) and Abstracts Views on Vision4Press platform.
Data correspond to usage on the plateform after 2015. The current usage metrics is available 48-96 hours after online publication and is updated daily on week days.
Initial download of the metrics may take a while.