Fig. C.1
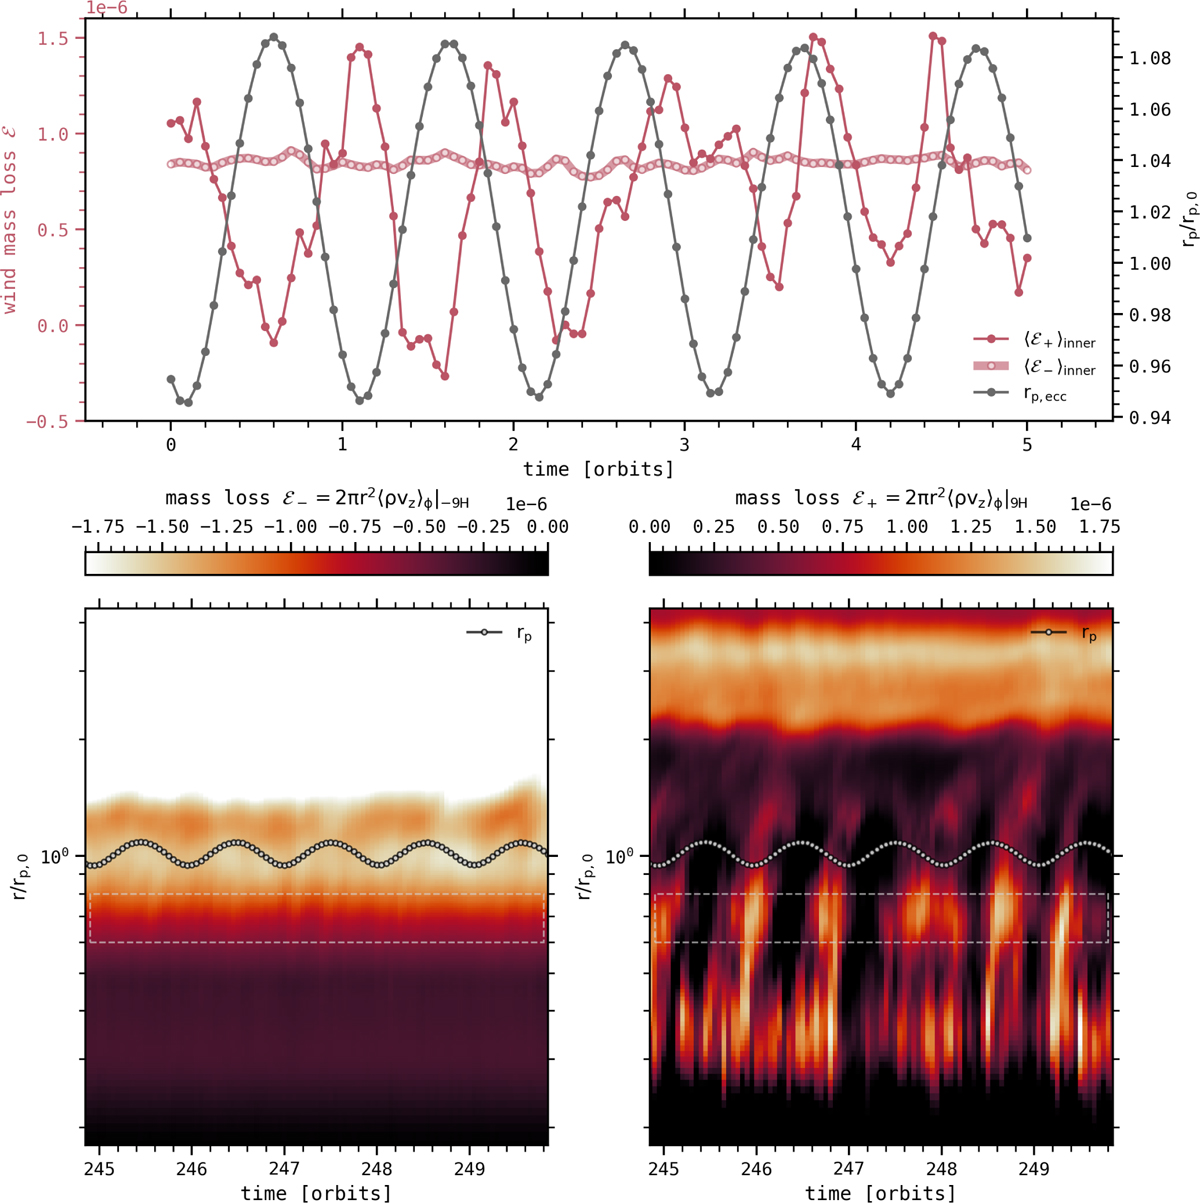
Download original image
Eccentricity-driven modulation of the ejection processes at two surfaces θ = Θ+ = arctan(9h) and θ = Θ− = − arctan(9h) for the run ℳ200. Top panel: 5-orbit evolution of the planet radius rp (gray line) and of the wind mass loss rate, averaged over the radial interval [0.6rp,0 − 0.8rp,0], and estimated at Θ+ (thin red line) and Θ− (thick red line). Bottom panels: 5-orbit space-time diagrams of ℰ− (left panel) and ℰ+ (right panel). The instantaneous radial position of the planet is indicated with white circles, and the radial interval used to average ℰ in the top panel is indicated by white dashed rectangles.
Current usage metrics show cumulative count of Article Views (full-text article views including HTML views, PDF and ePub downloads, according to the available data) and Abstracts Views on Vision4Press platform.
Data correspond to usage on the plateform after 2015. The current usage metrics is available 48-96 hours after online publication and is updated daily on week days.
Initial download of the metrics may take a while.