Fig. 1
Download original image
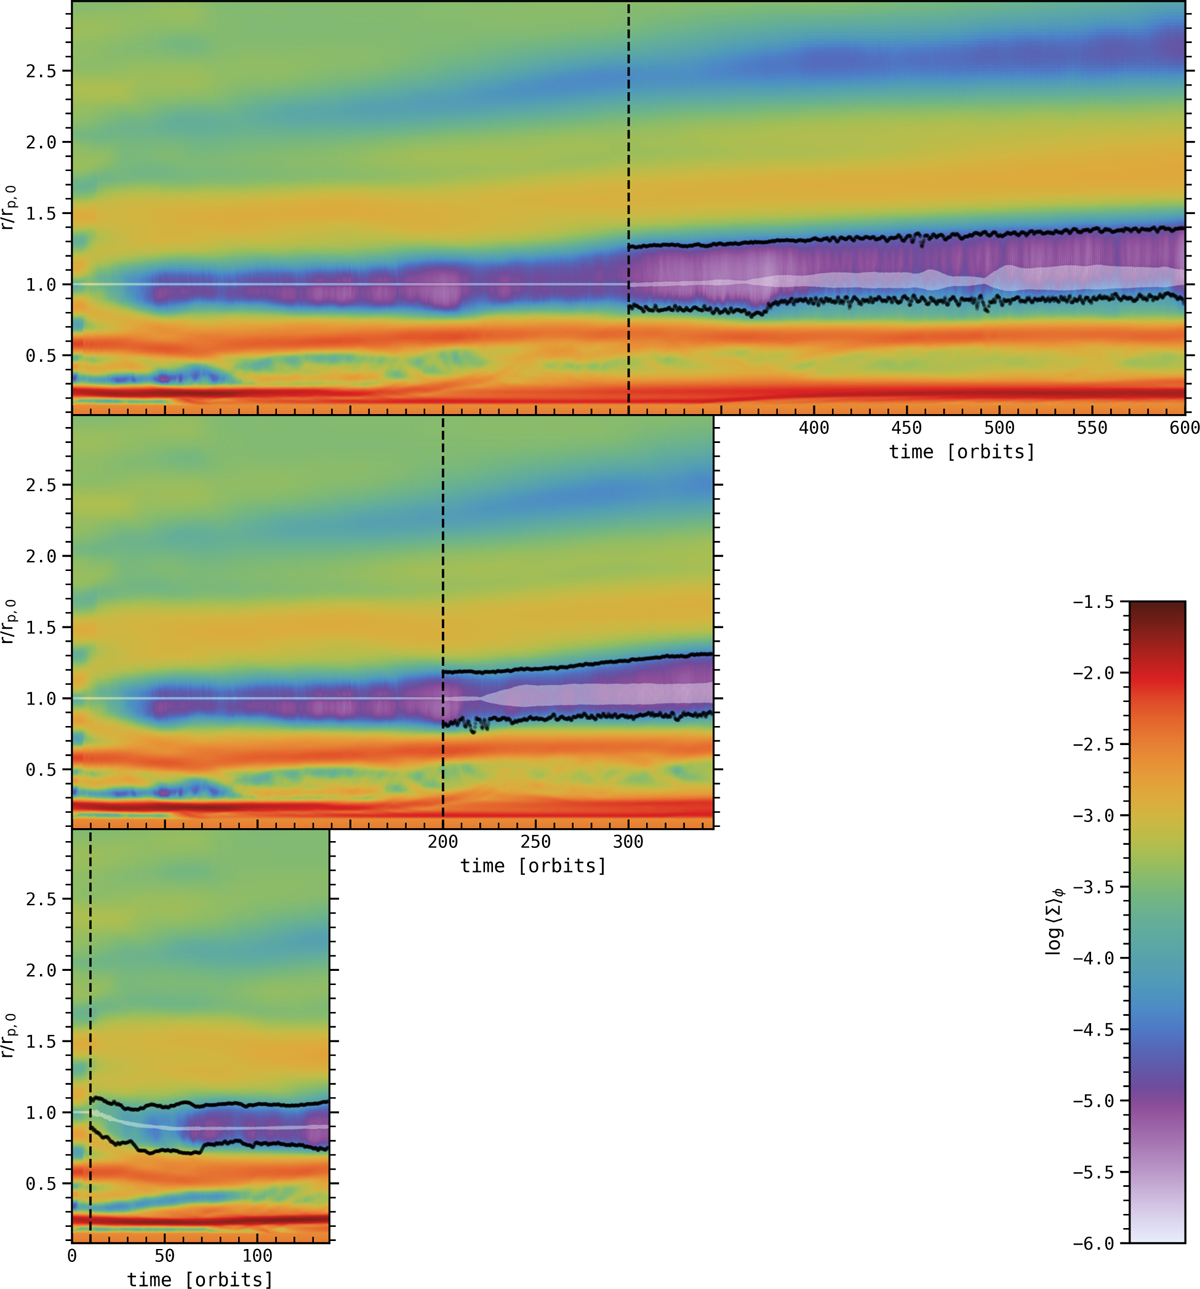
Space-time diagram showing the evolution of the azimuthally-averaged gas surface density ∑, for the three runs ℳ300 (top panel), ℳ200 (middle panel), and ℳ10 (bottom panel). The radial extent of all the diagrams range from 0.08 rp,0 to 3rp,0, with the planet initially at rp,0 = 1. The fixed regime is separated from the migrating regime by the vertical black dashed line, and the instantaneous position of the planet is represented by the semi-transparent white line. The estimated inner and outer gap edges in the migrating regime are indicated by the black dotted lines.
Current usage metrics show cumulative count of Article Views (full-text article views including HTML views, PDF and ePub downloads, according to the available data) and Abstracts Views on Vision4Press platform.
Data correspond to usage on the plateform after 2015. The current usage metrics is available 48-96 hours after online publication and is updated daily on week days.
Initial download of the metrics may take a while.