Fig. E.1.
Download original image
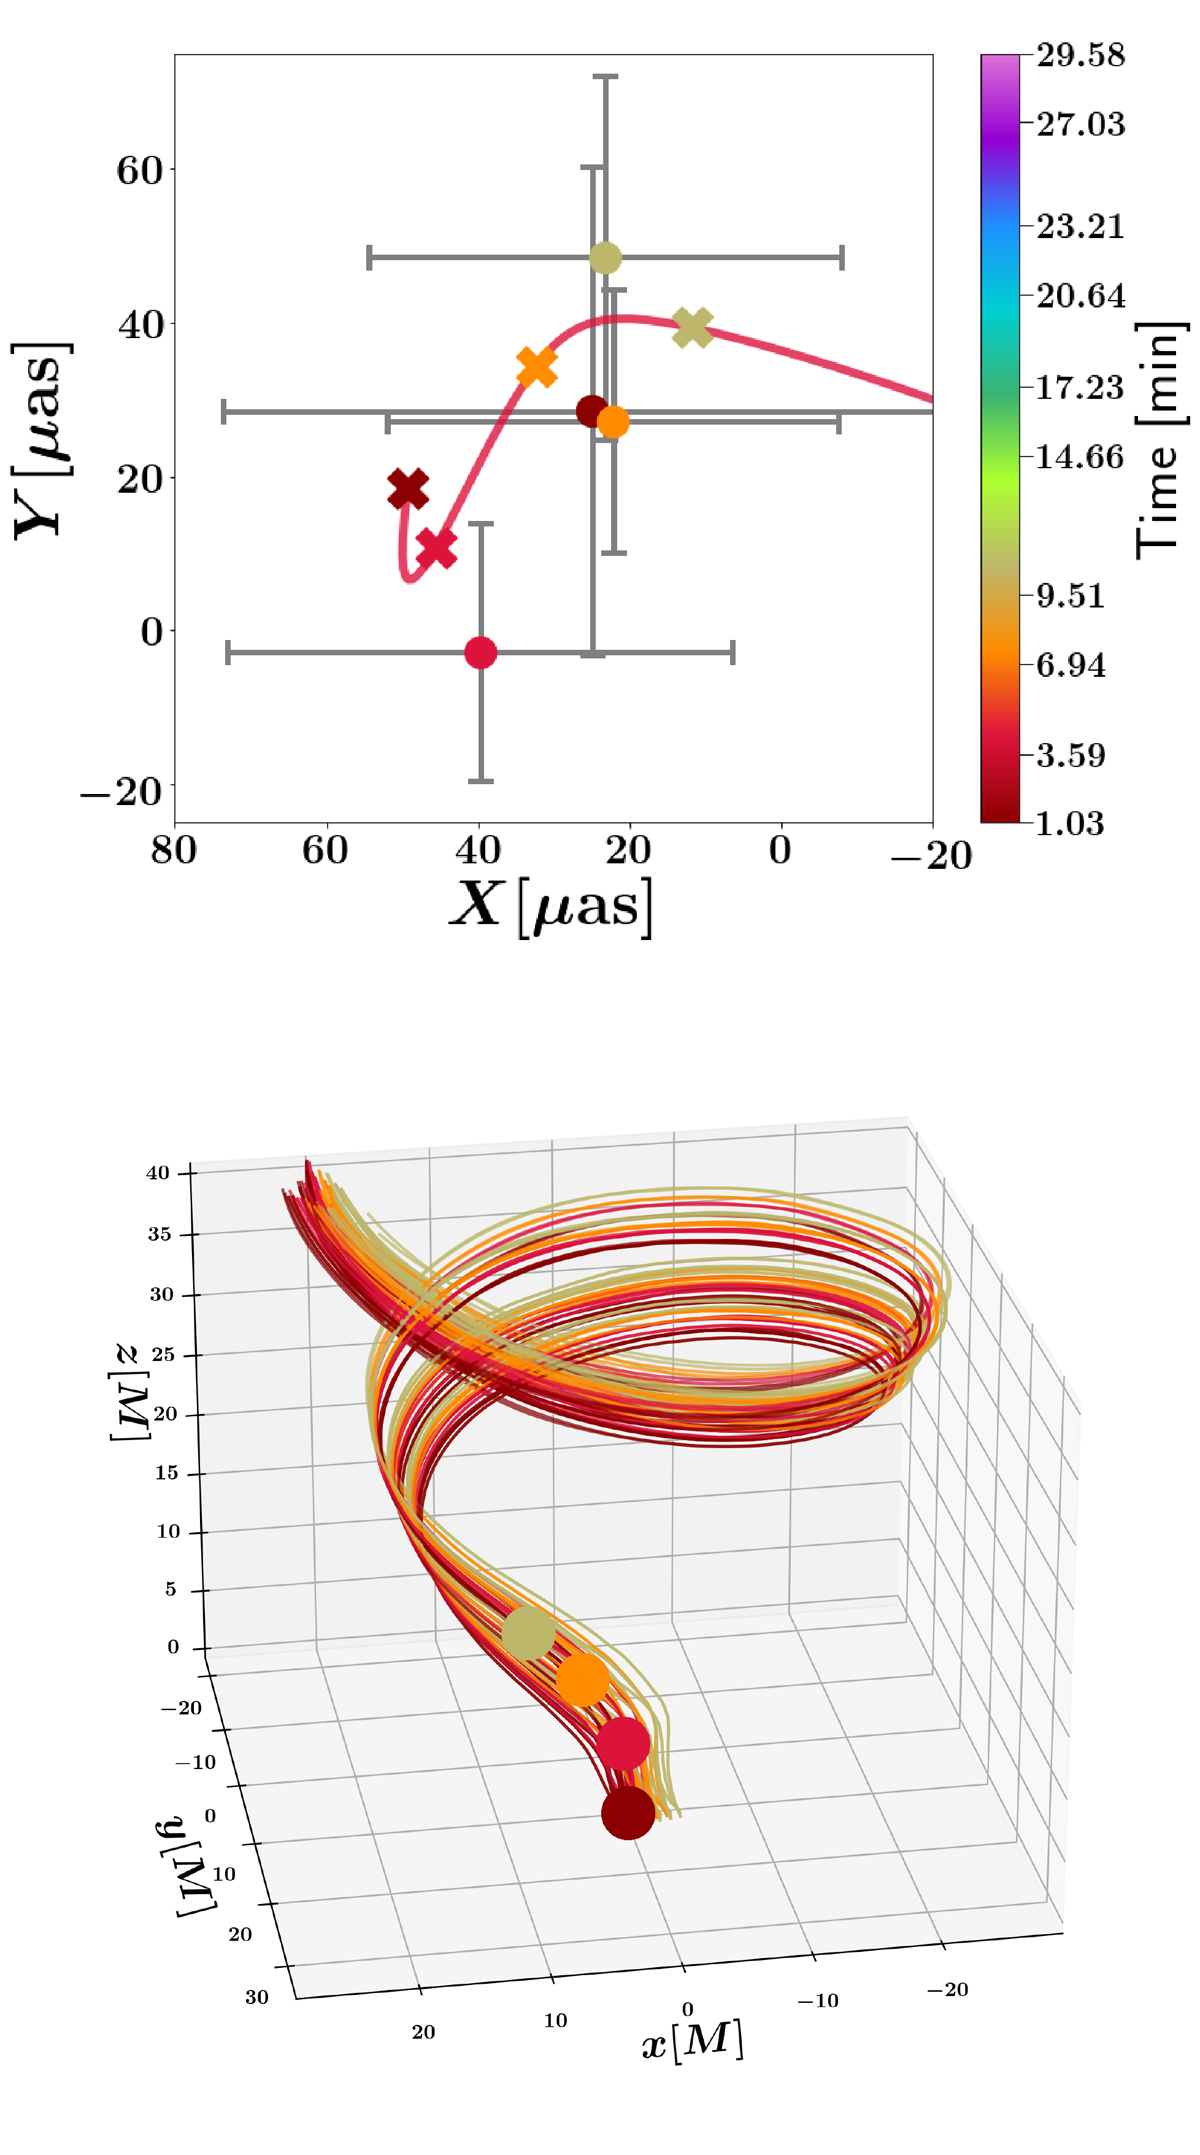
One of the flare models illustrated in Fig. 3 capable of capturing the kinematics of the first data points. Top panel: Close-up view of the selected flare model overlapped with the first four observed flaring positions. Bottom panel: Three-dimensional visualization of the corresponding flux tube. The hot spot positions for the first four data points are color-coordinated with the associated points in the top panel.
Current usage metrics show cumulative count of Article Views (full-text article views including HTML views, PDF and ePub downloads, according to the available data) and Abstracts Views on Vision4Press platform.
Data correspond to usage on the plateform after 2015. The current usage metrics is available 48-96 hours after online publication and is updated daily on week days.
Initial download of the metrics may take a while.