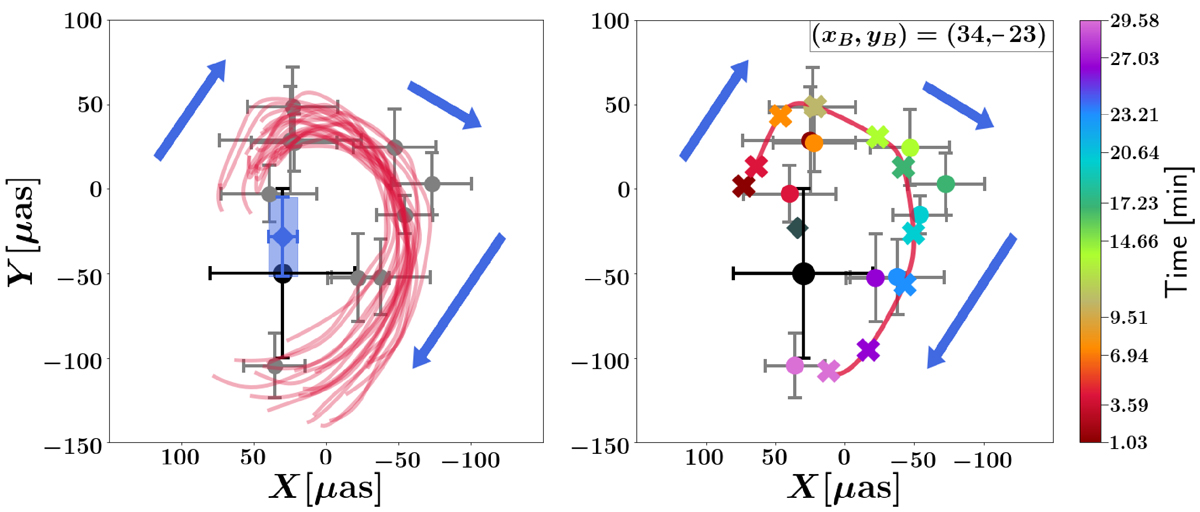
Fig. 3.
Download original image
Hot spot trajectories along the magnetized flux tubes generated during the prominent flaring event overlapped with the observations of July 22, 2018 (gray and colored circles, respectively). The direction of motion is indicated by blue arrows. The position of SgrA* in the sky is denoted by a black cross. Left panel: Flare models for hot spot ejection velocities between 0.5c and 0.8c and foot-point orbital velocities ranging from 0.1uK − 0.4uK. The best-fit black hole position, which is slightly different for each model, is illustrated by a blue rectangle. Right panel: Flare model that provides the best fit to the GRAVITY observations. The position of the black hole is depicted by a black diamond.
Current usage metrics show cumulative count of Article Views (full-text article views including HTML views, PDF and ePub downloads, according to the available data) and Abstracts Views on Vision4Press platform.
Data correspond to usage on the plateform after 2015. The current usage metrics is available 48-96 hours after online publication and is updated daily on week days.
Initial download of the metrics may take a while.