Fig. 7.
Download original image
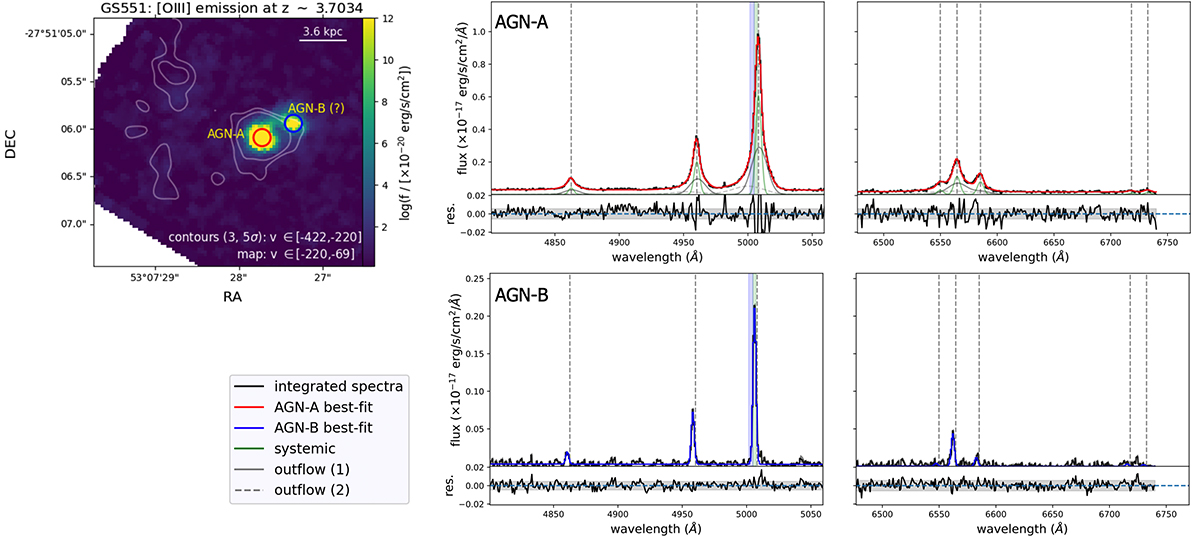
[O III] map (top-right) and integrated spectra of the candidate dual AGN system associated with GS551. The [O III] map is obtained by integrating the [O III] emission over a specific velocity range (as labelled), in order to highlight the primary (AGN-A) and secondary (AGN-B) nuclei, together with additional structures at the same redshift of the active galaxies. The remaining panels show the integrated spectra of the primary (top-right) and secondary (bottom-right) AGNs. The legend display the individual Gaussian components and best-fit curves shown in the spectra; best-fit total profiles are represented in red for AGN-A, and in blue for AGN-B. Residuals, defined as the difference between the observed data and the best-fit model, are displayed at the bottom of each panel, with grey shaded regions indicating the average ±3σ uncertainties on the data. The vertical green shaded area at ∼5007 Å marks the channels used to generate the [O III] map, while the blue shaded area marks those associated with extended emission marked with contours overlapping the map.
Current usage metrics show cumulative count of Article Views (full-text article views including HTML views, PDF and ePub downloads, according to the available data) and Abstracts Views on Vision4Press platform.
Data correspond to usage on the plateform after 2015. The current usage metrics is available 48-96 hours after online publication and is updated daily on week days.
Initial download of the metrics may take a while.