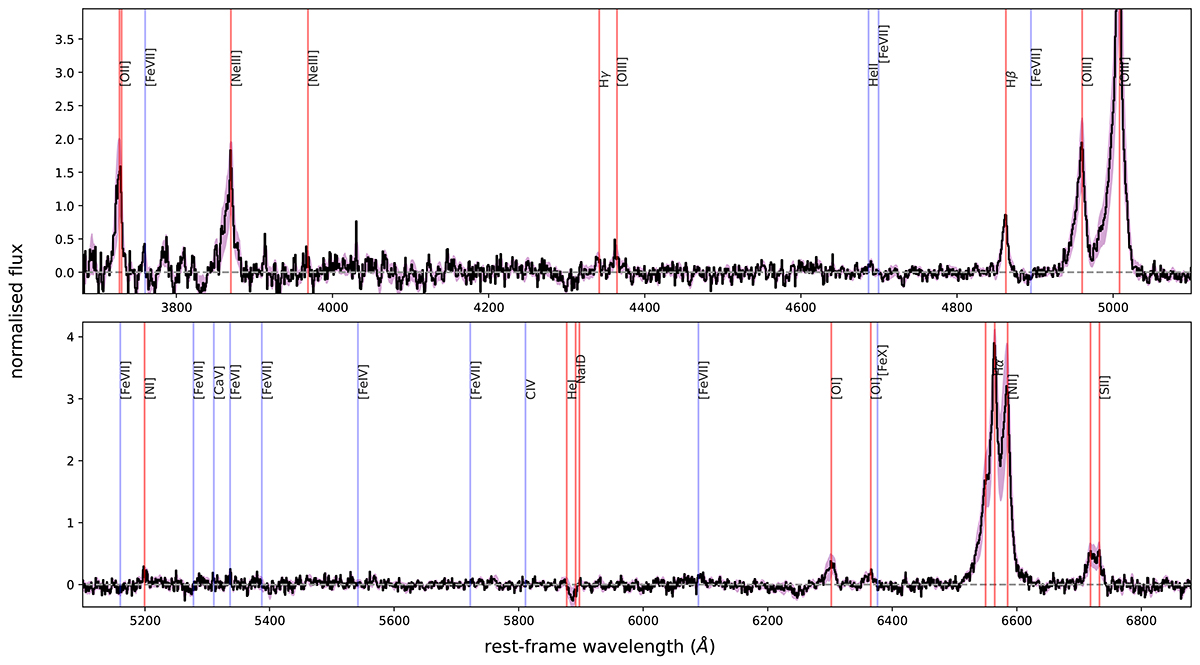
Fig. C.2.
Download original image
Composite spectrum of X-ray detected AGNs at z ∼ 3. The spectrum is obtained by combining the continuum-subtracted (0.15″ × 0.15″) spectra of the X-ray detected type 2 AGNs GS10578-A, COS1656-A, GS551-A, GS133, GS19293, GS20936, by employing a bootstrap method (Perna et al. 2017b); before the combine, all spectra were normalised to the Hβ peak. Red vertical lines identify the main optical lines, while blue lines mark the position of CLs. No CLs are detected in the composite spectrum.
Current usage metrics show cumulative count of Article Views (full-text article views including HTML views, PDF and ePub downloads, according to the available data) and Abstracts Views on Vision4Press platform.
Data correspond to usage on the plateform after 2015. The current usage metrics is available 48-96 hours after online publication and is updated daily on week days.
Initial download of the metrics may take a while.