Fig. 11.
Download original image
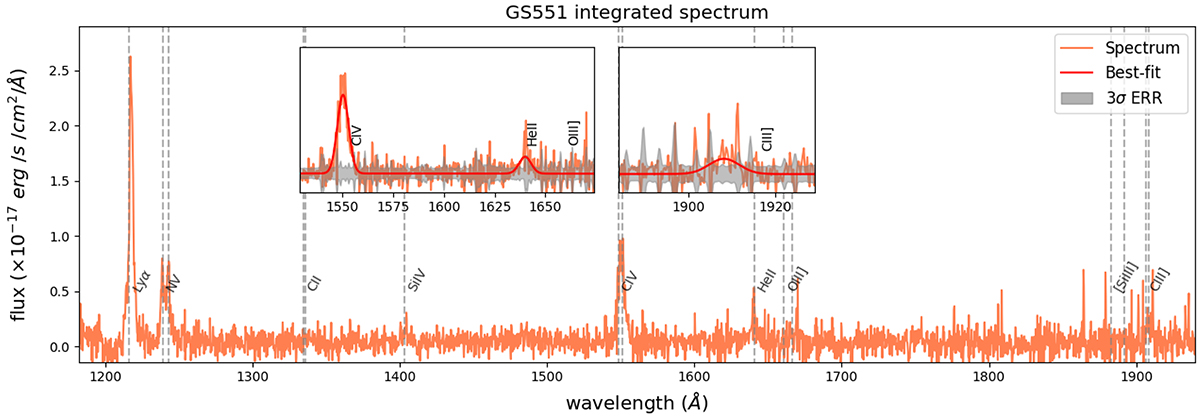
MUSE spectra of GS551 (coral), showing AGN-ionised lines, according to UV diagnostics (Fig. 12). These spectra were obtained by integrating over the regions at S/N > 4 in Fig. 2; for visual purposes, the LAE2 spectrum was shifted, as labelled. The zoom-in insets show the same spectra in the vicinity of the lines used in the UV diagnostics, together with 1σ errors for the LAE2 spectrum (green curve, mostly highlighting the position of strong sky line residuals).
Current usage metrics show cumulative count of Article Views (full-text article views including HTML views, PDF and ePub downloads, according to the available data) and Abstracts Views on Vision4Press platform.
Data correspond to usage on the plateform after 2015. The current usage metrics is available 48-96 hours after online publication and is updated daily on week days.
Initial download of the metrics may take a while.