Open Access
Fig. 7
Download original image
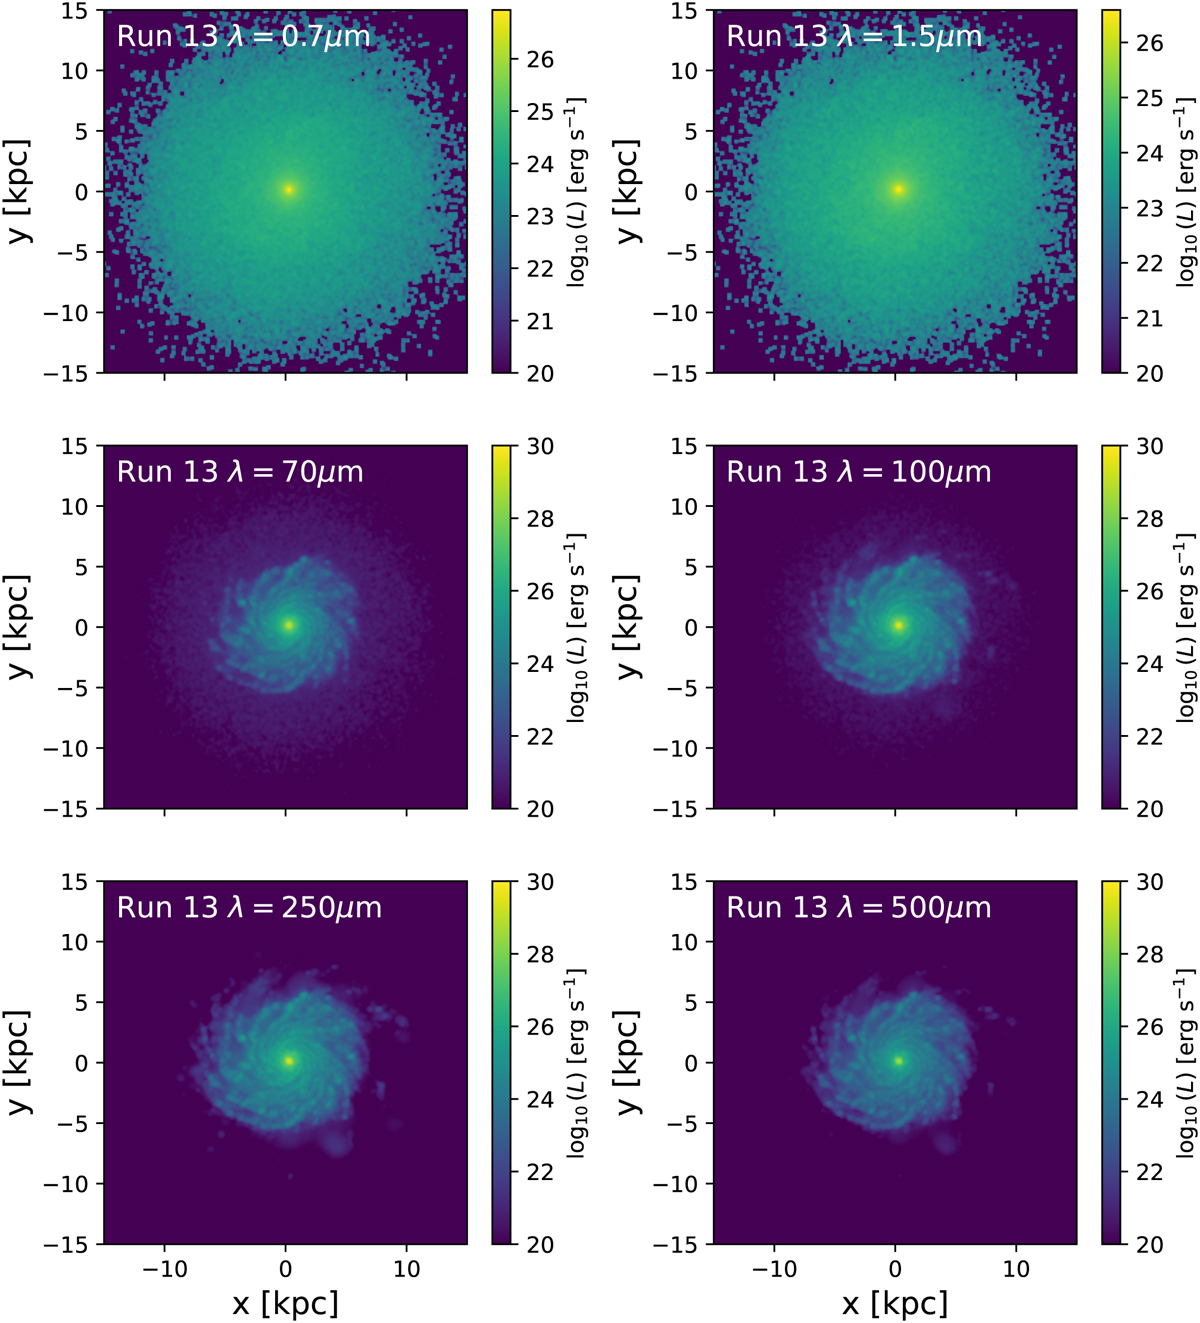
Dust continuum luminosity images at λ = 0.7 µm (top left), λ = 1.5 µm (top right), λ = 70 µm (mid left), λ = 100 µm (mid right), λ = 250 µm (bottom left), and λ = 500 µm (bottom right), viewed face-on, for run 13, after ∆t = 0.2 Gyr from the end of the relaxation phase.
Current usage metrics show cumulative count of Article Views (full-text article views including HTML views, PDF and ePub downloads, according to the available data) and Abstracts Views on Vision4Press platform.
Data correspond to usage on the plateform after 2015. The current usage metrics is available 48-96 hours after online publication and is updated daily on week days.
Initial download of the metrics may take a while.