Fig. 9.
Download original image
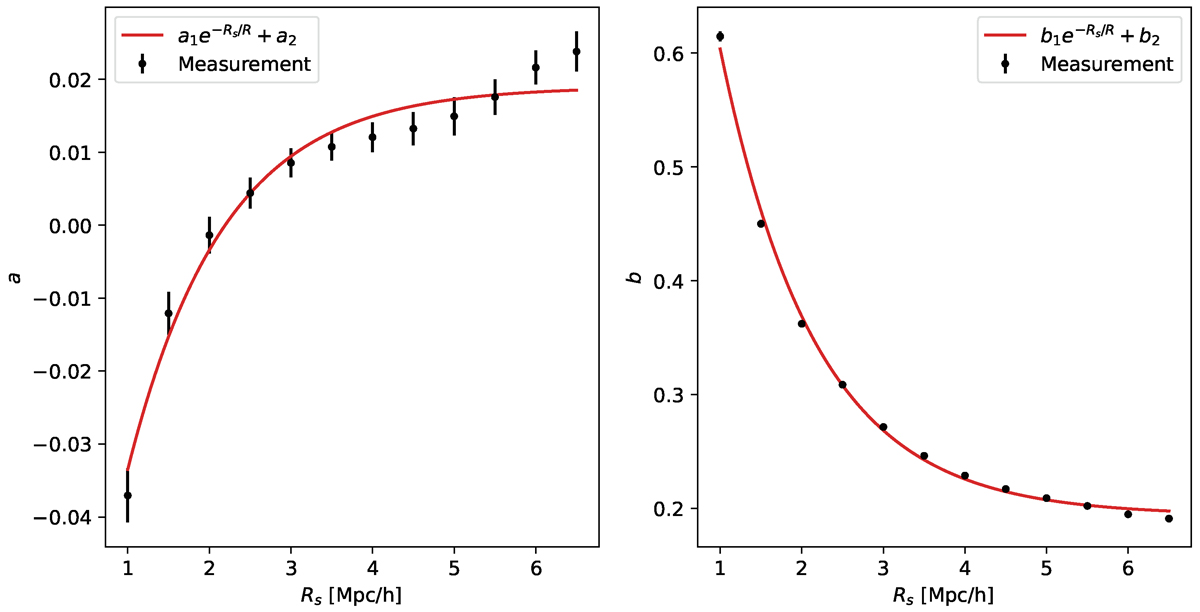
Parameters a and b defined in Eq. (12) and measured by least squares applied to each value of Rs used to obtain λCV in the MG-COLA set of simulations. The error bars (small in the right panel) are given by the square root of the diagonal elements in the covariance matrix. Both parameters have been approximated to an exponential type function plotted in red, whose constants are given in Table 4. The result of the approximation is a fit ![]() represented in Fig. 5 by dashed lines.
represented in Fig. 5 by dashed lines.
Current usage metrics show cumulative count of Article Views (full-text article views including HTML views, PDF and ePub downloads, according to the available data) and Abstracts Views on Vision4Press platform.
Data correspond to usage on the plateform after 2015. The current usage metrics is available 48-96 hours after online publication and is updated daily on week days.
Initial download of the metrics may take a while.