Fig. 5.
Download original image
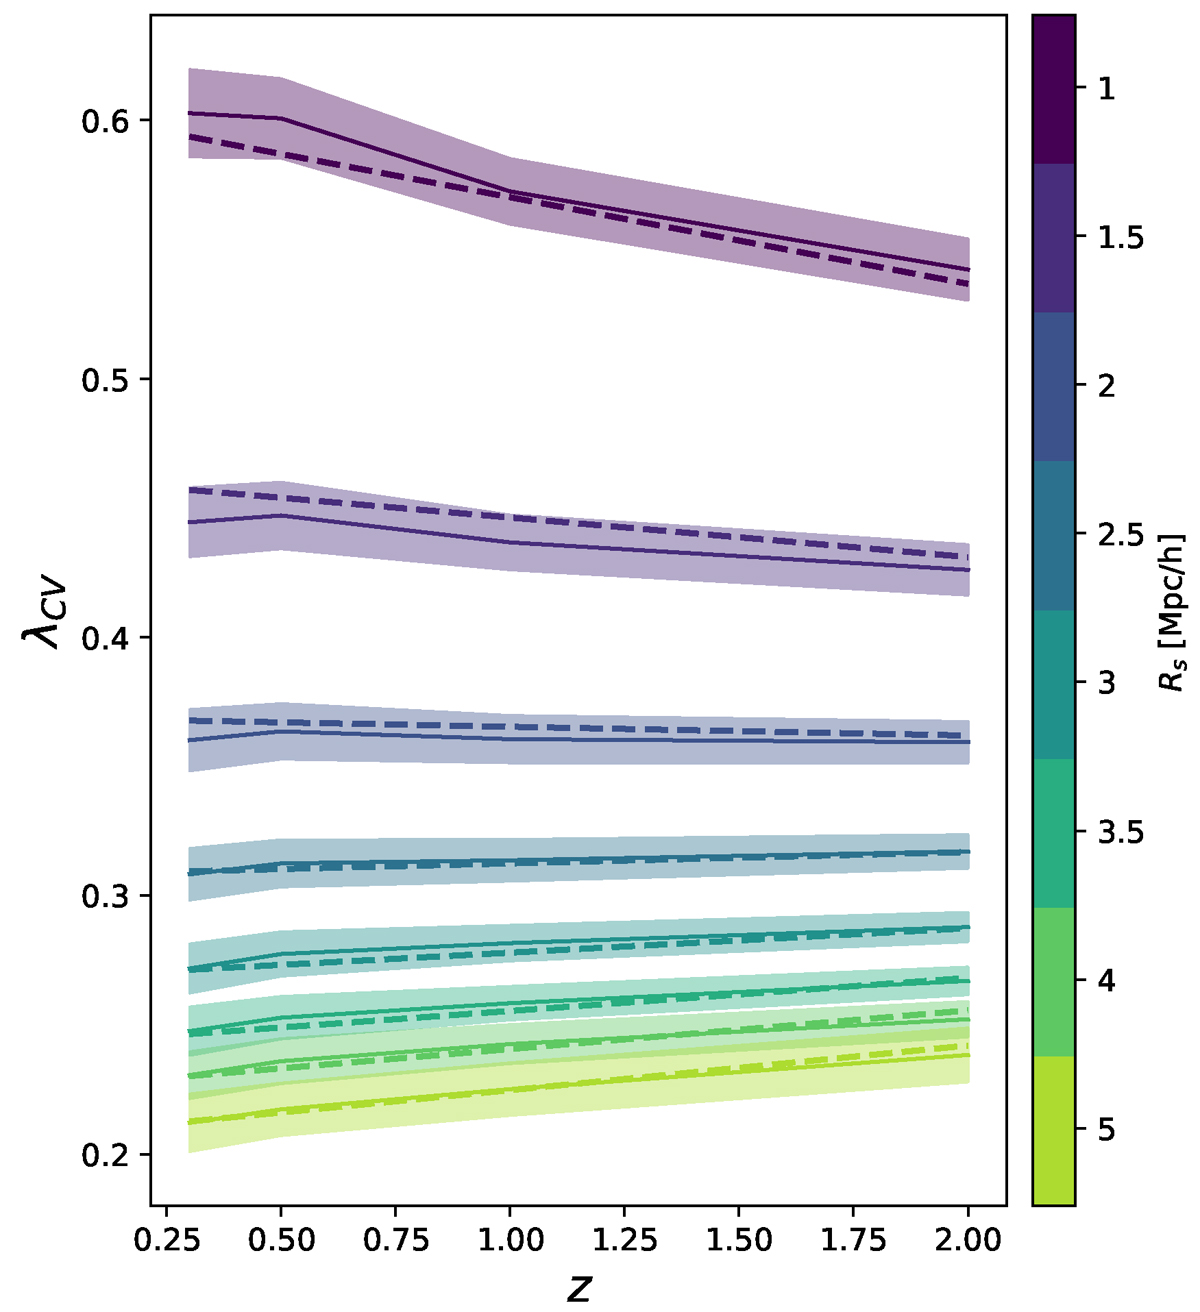
Mean of λCV computed using the minimum of the function S in each simulation of our set, shown as solid lines. The dashed lines correspond to the fit defined in Eq. (13), as explained in Sect. 5.1. The different colours correspond to the smoothing length used in the analysis, with the shading indicating the σ region of the set.
Current usage metrics show cumulative count of Article Views (full-text article views including HTML views, PDF and ePub downloads, according to the available data) and Abstracts Views on Vision4Press platform.
Data correspond to usage on the plateform after 2015. The current usage metrics is available 48-96 hours after online publication and is updated daily on week days.
Initial download of the metrics may take a while.