Fig. 3.
Download original image
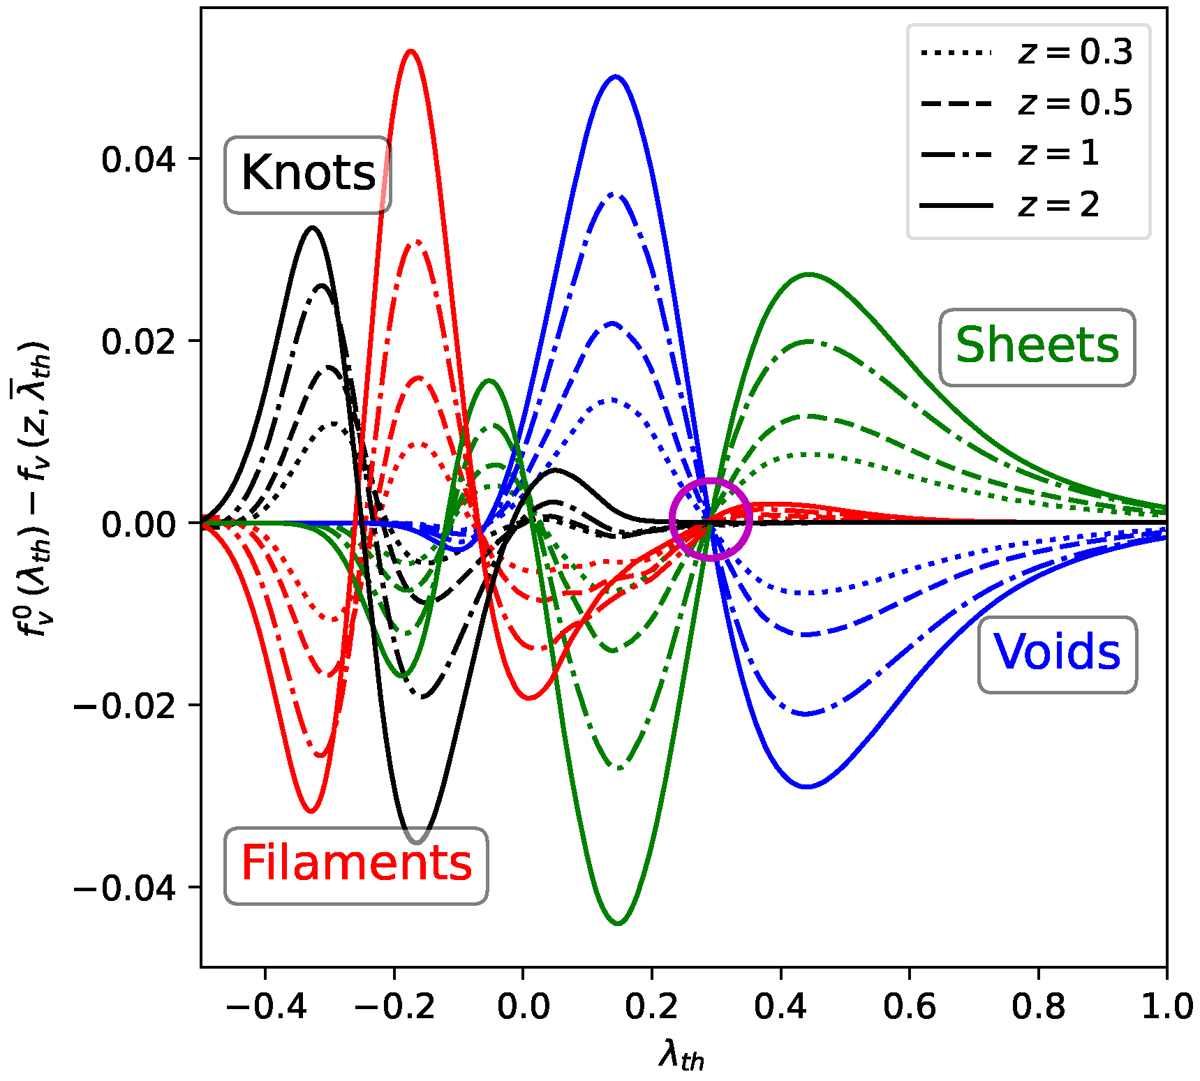
Evolution of the difference in volume fractions after λth normalization defined in Eq. (8). Each line is the volume fraction at z = 0 minus the volume fraction at other redshifts (differentiated with the type of pattern), as a function of λth. The colour code, simulation, and RS value is the same as the one used in Fig. 2. The magenta circle marks the constant volume threshold λCV in which the volume fractions of each element become approximately constant over time.
Current usage metrics show cumulative count of Article Views (full-text article views including HTML views, PDF and ePub downloads, according to the available data) and Abstracts Views on Vision4Press platform.
Data correspond to usage on the plateform after 2015. The current usage metrics is available 48-96 hours after online publication and is updated daily on week days.
Initial download of the metrics may take a while.