Fig. 2
Download original image
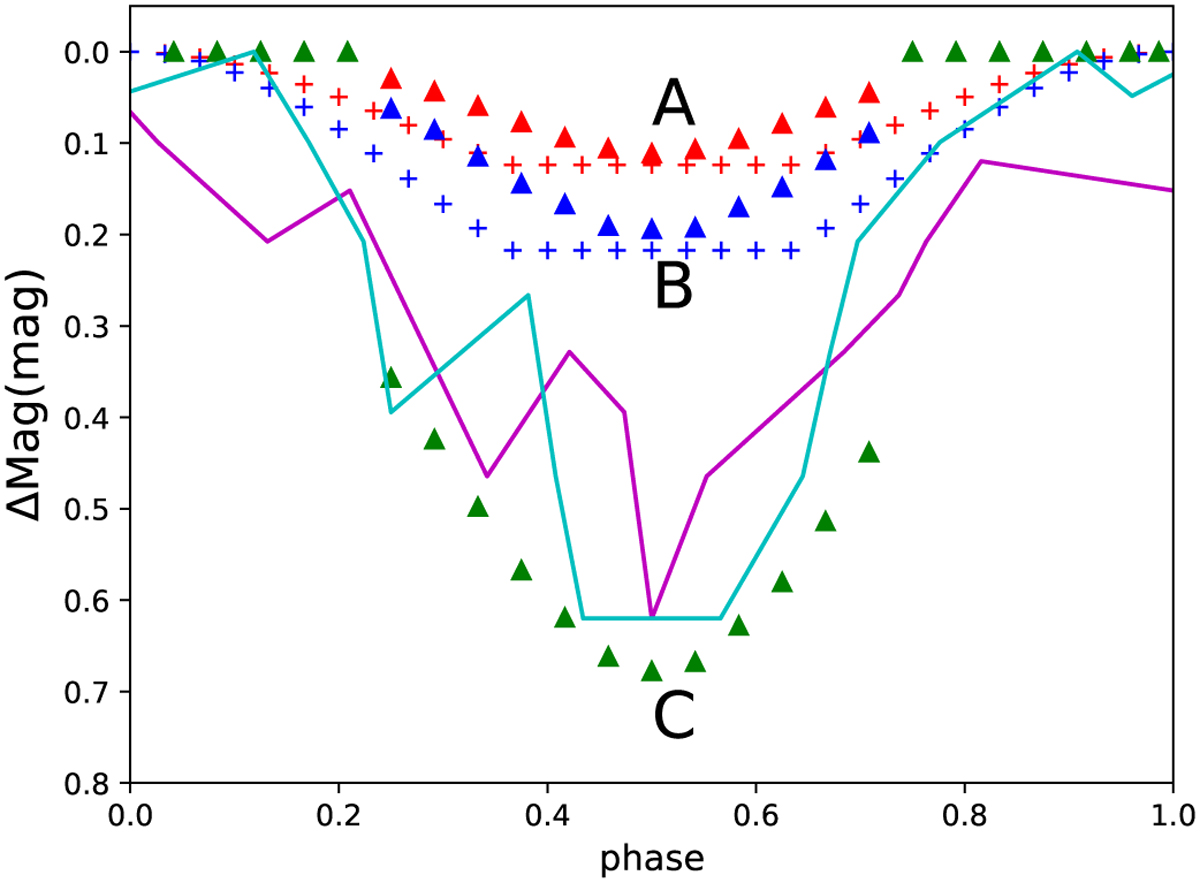
Light curves for models A (red triangles), B (blue triangles), and C (green triangles) in Table 1. These curves are able to explain the typical values of Δmag seen in the TESS LC (see text and Fig. 1). Model A reproduces dips with Δmag = 0.1, model B for Δmag = 0.2, and model C for Δmag = 0.7. We also include LCs formed with spots covering a fraction of the stellar surface (red and blue plus signs). For comparison, we include the features at JD 60 2240 (magenta line) and JD 60 244 (cyan line) in the TESS LC.
Current usage metrics show cumulative count of Article Views (full-text article views including HTML views, PDF and ePub downloads, according to the available data) and Abstracts Views on Vision4Press platform.
Data correspond to usage on the plateform after 2015. The current usage metrics is available 48-96 hours after online publication and is updated daily on week days.
Initial download of the metrics may take a while.