Fig. 8
Download original image
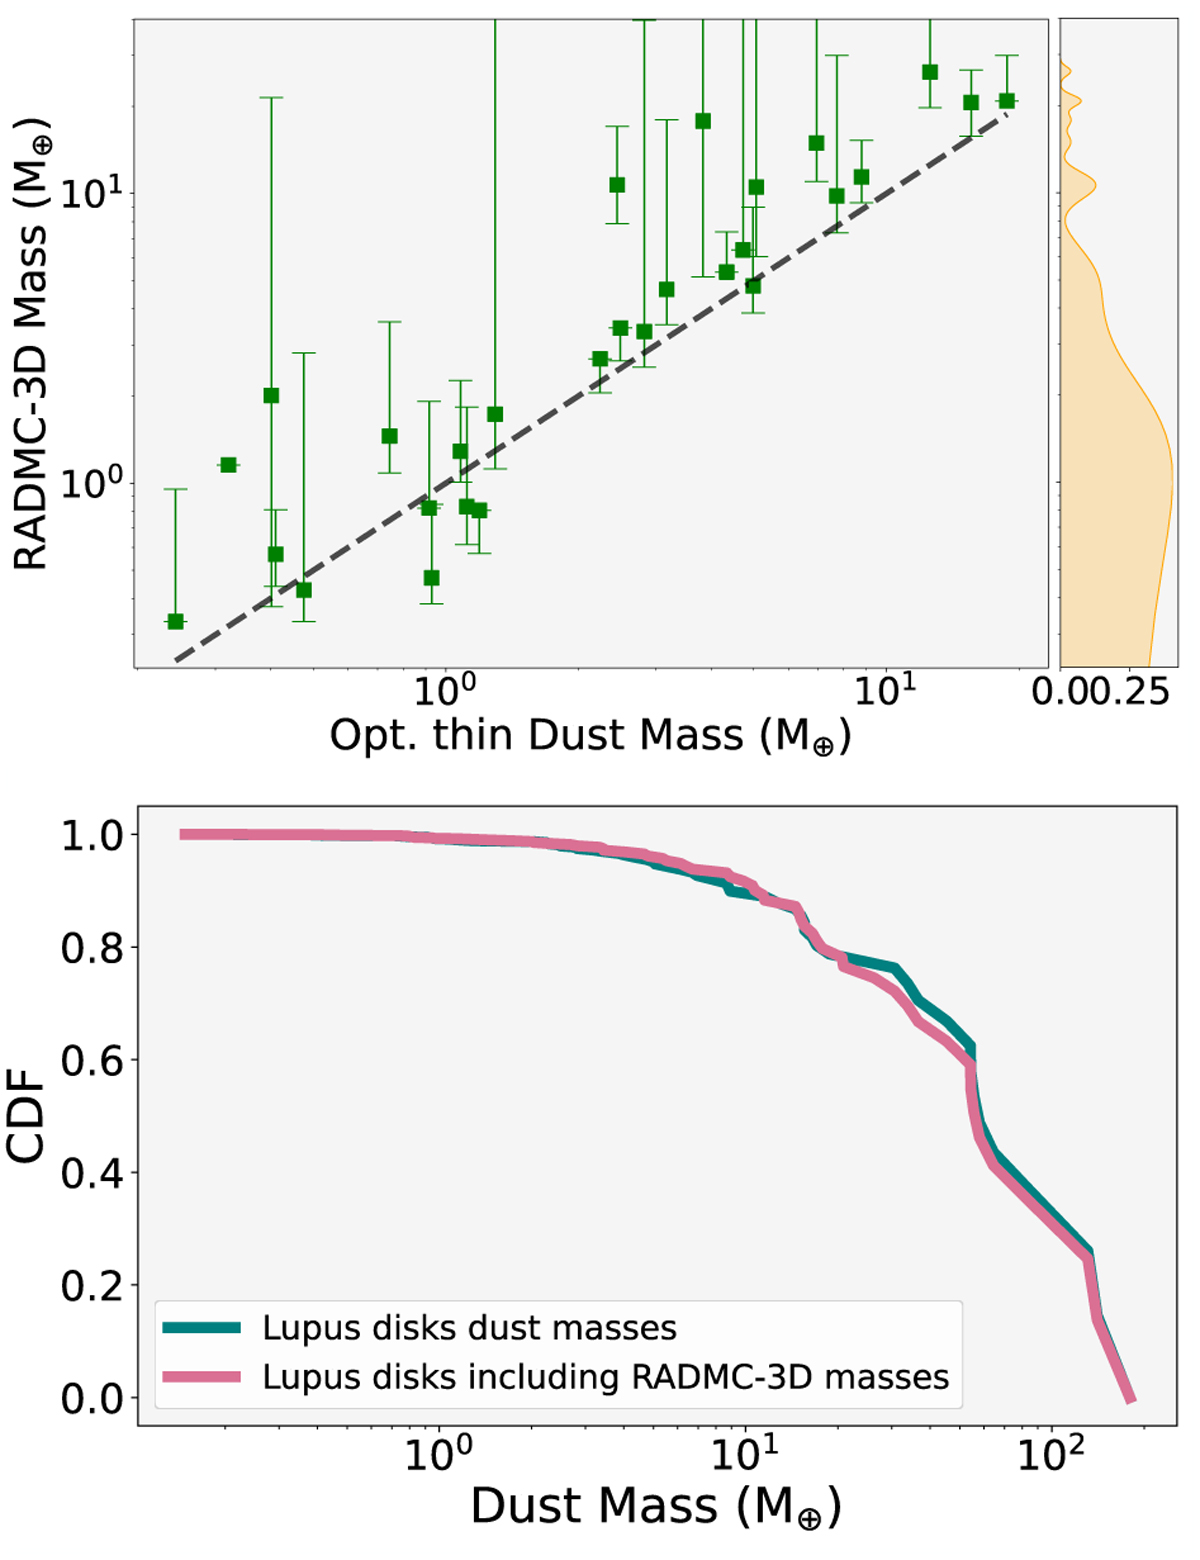
Top panel: masses of the compact disks in Lupus (R < 30 au). These masses were obtained through the RADMC-3D model grid for τ < 5. The dashed black line indicates where the RADMC-3D dust mass equals the optically thin dust mass calculation (see Eq. 10). Top-right panel: Kernel density estimation of the disk dust masses. Bottom panel: cumulative distribution functions (CDFs) of all the disk masses in Lupus, using two approaches: in teal, all masses are estimated with the optically thin approximation based on flux values (Eq. (10)), and in pink, we substitute the masses with values derived from our model grid where available.
Current usage metrics show cumulative count of Article Views (full-text article views including HTML views, PDF and ePub downloads, according to the available data) and Abstracts Views on Vision4Press platform.
Data correspond to usage on the plateform after 2015. The current usage metrics is available 48-96 hours after online publication and is updated daily on week days.
Initial download of the metrics may take a while.