Fig. 6
Download original image
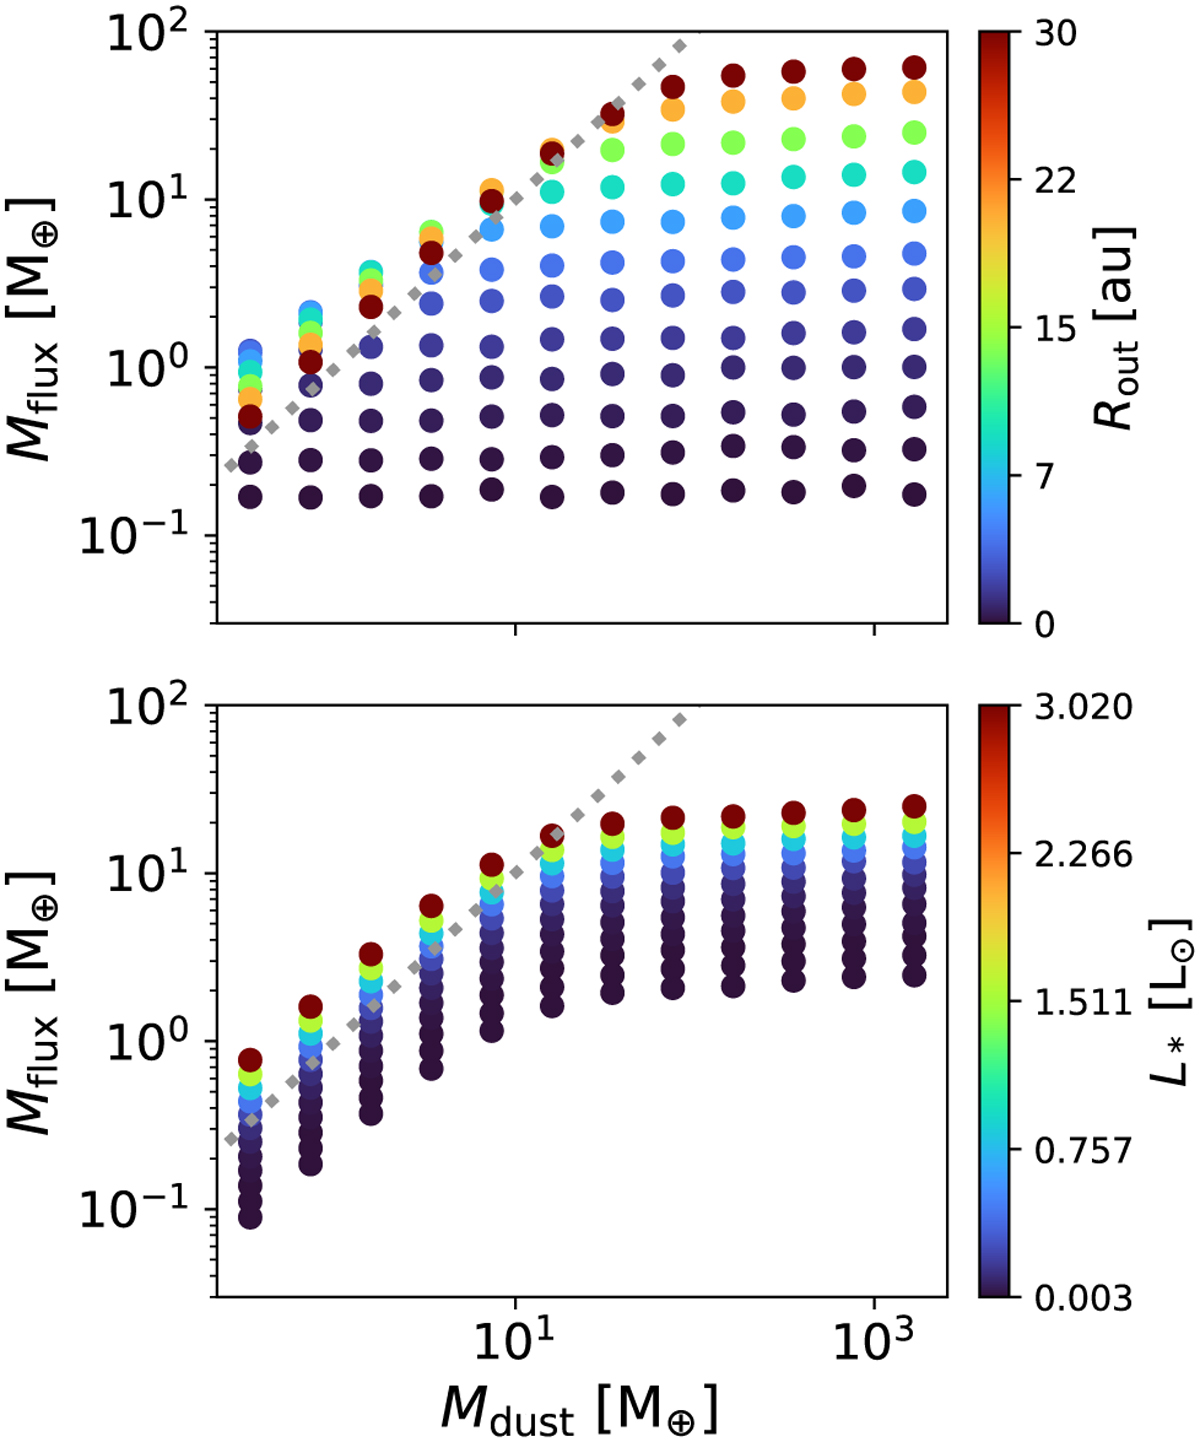
Comparison of the disk dust mass from a grid of 1728 models versus the mass derived from flux for the same models. In the top panel, stellar luminosity and effective temperature are fixed, illustrating how disk radius varies with flux and dust mass (see the colorbar with the radius values). The bottom panel shows the effect of changing stellar luminosity while keeping the disk radius and effective temperature constant. The dotted gray line highlights the masses from the flux that equal the disk dust mass introduced in the models.
Current usage metrics show cumulative count of Article Views (full-text article views including HTML views, PDF and ePub downloads, according to the available data) and Abstracts Views on Vision4Press platform.
Data correspond to usage on the plateform after 2015. The current usage metrics is available 48-96 hours after online publication and is updated daily on week days.
Initial download of the metrics may take a while.