Fig. 4
Download original image
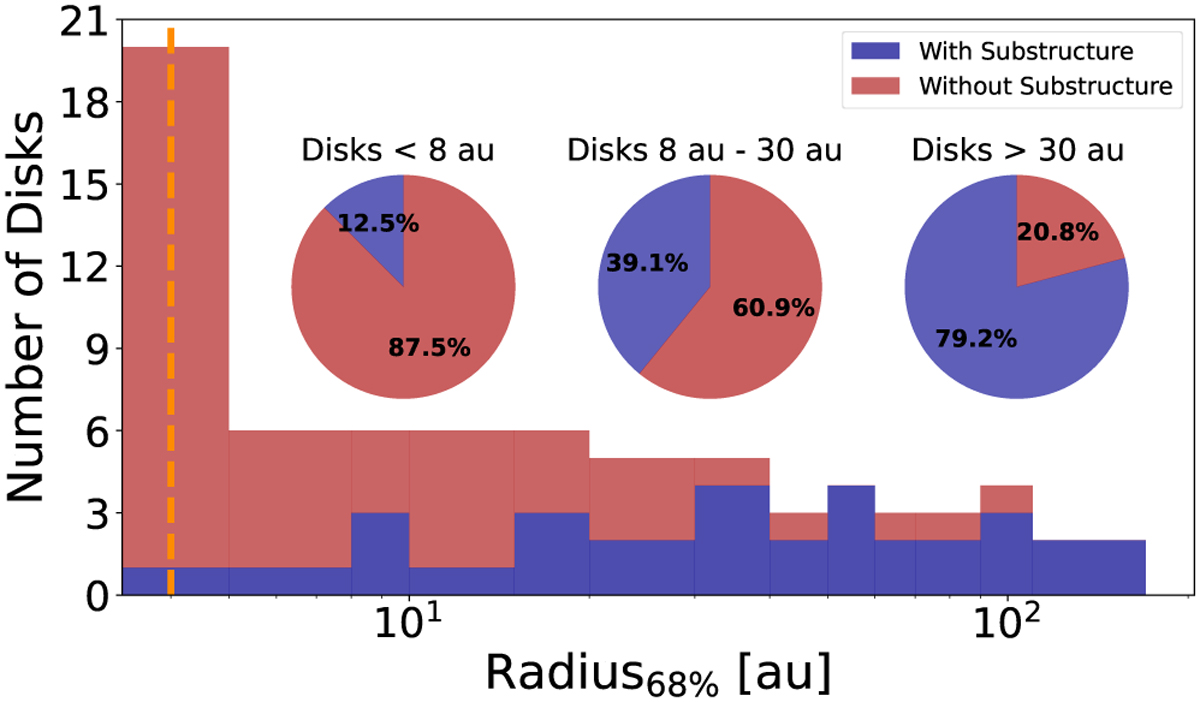
Size distribution of the Lupus disks. Disks exhibiting substructures in the continuum images are shown in dark blue, while smooth disks without visible substructures are depicted in red and added on top of the blue histogram. The pie charts inside the plot show the percentages of disks with and without substructures for sizes above and below 30 au. The vertical dashed orange line indicates our resolution limit, which is set at 0.03″ (4 au). More than 67% of the sample belongs to the compact disks classification.
Current usage metrics show cumulative count of Article Views (full-text article views including HTML views, PDF and ePub downloads, according to the available data) and Abstracts Views on Vision4Press platform.
Data correspond to usage on the plateform after 2015. The current usage metrics is available 48-96 hours after online publication and is updated daily on week days.
Initial download of the metrics may take a while.