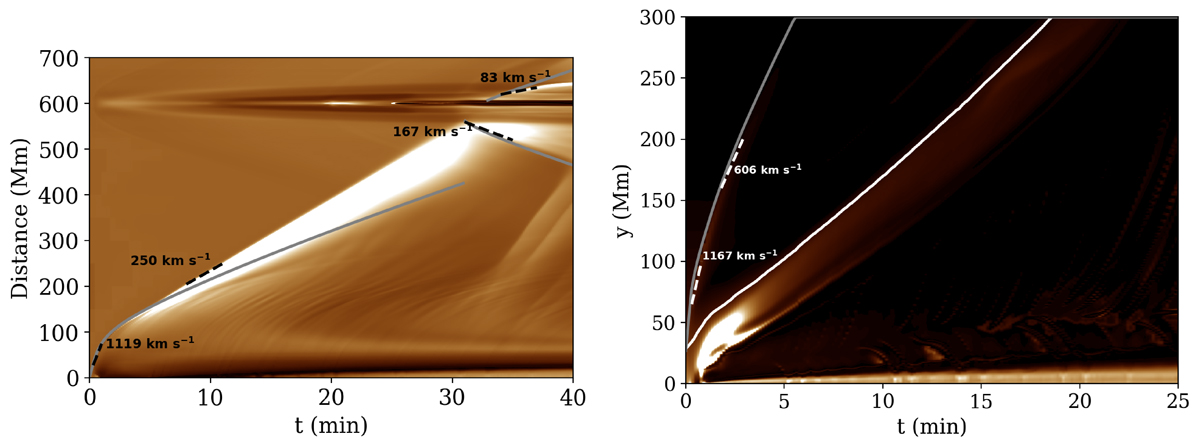
Fig. 9.
Download original image
Time-distance diagrams of 193 Å channel taken along the horizontal cut y = 10 Mm (left) and the vertical cut at x = 0 Mm (right). The vertical axis in the left panel corresponds to the distance from the eruption. The white solid line in the right panel denotes the instantaneous center of the EFR. The gray lines in both panels denote the propagation according to the local phase speed of fast and slow magnetoacoustic waves.
Current usage metrics show cumulative count of Article Views (full-text article views including HTML views, PDF and ePub downloads, according to the available data) and Abstracts Views on Vision4Press platform.
Data correspond to usage on the plateform after 2015. The current usage metrics is available 48-96 hours after online publication and is updated daily on week days.
Initial download of the metrics may take a while.