Fig. 8.
Download original image
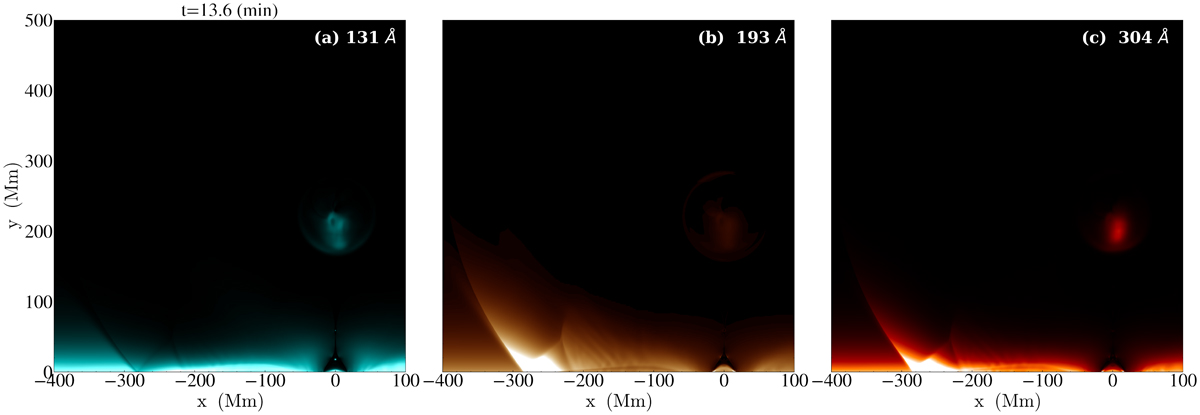
Synthetic SDO/AIA channel images (131, 193, and 304 Å) of the eruption area at 13.6 minutes. The saturation levels for the fluxes in the 131, 193, and 304 Å channels are defined as follows: 1.5 × 10⁻⁸, 3.0 × 10⁻⁷, 8.0 × 10⁻⁹ DN cm−1 s−1 pixel−1, respectively. We note that these saturation levels are applied to all synthetic images presented in this paper. Animation 3 shows the temporal evolution up to 28.6 minutes. An animation of this figure is available online.
Current usage metrics show cumulative count of Article Views (full-text article views including HTML views, PDF and ePub downloads, according to the available data) and Abstracts Views on Vision4Press platform.
Data correspond to usage on the plateform after 2015. The current usage metrics is available 48-96 hours after online publication and is updated daily on week days.
Initial download of the metrics may take a while.