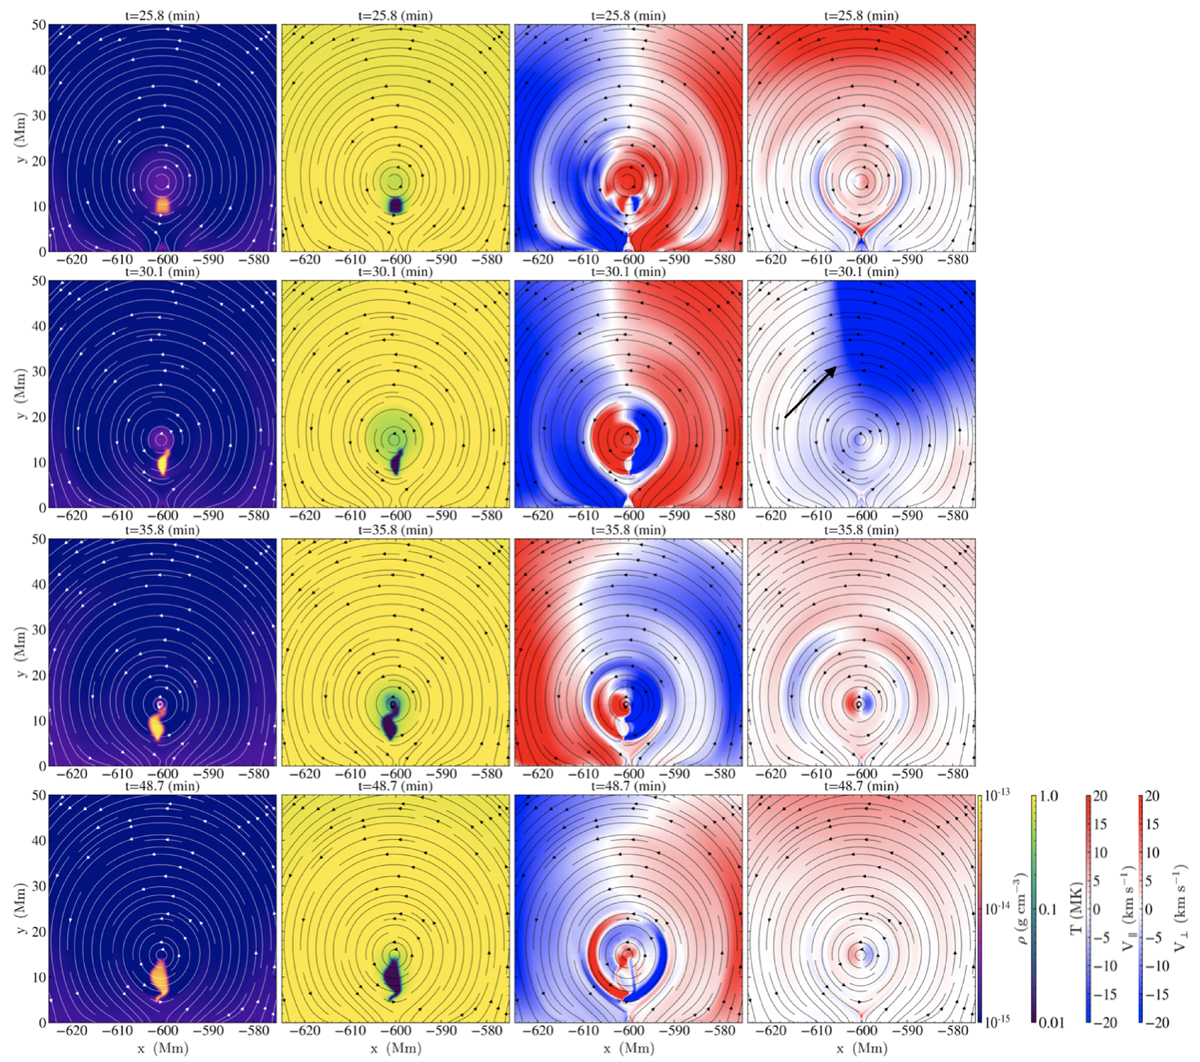
Fig. A.1.
Download original image
Density, temperature, v∥, and v⊥ distributions during various stages of the experiment, focusing especially on the deformed bipolar region that hosts the prominence: prominence mass loading (first row), the wave interaction with the prominence (second row), prominence oscillations and mass accretion (third and fourth rows). The black arrow denotes the primary front. Animation 4 shows the temporal evolution of the density, temperature, and the corresponding velocities up to 57.2 minutes. An animation of this figure is available online.
Current usage metrics show cumulative count of Article Views (full-text article views including HTML views, PDF and ePub downloads, according to the available data) and Abstracts Views on Vision4Press platform.
Data correspond to usage on the plateform after 2015. The current usage metrics is available 48-96 hours after online publication and is updated daily on week days.
Initial download of the metrics may take a while.