Open Access
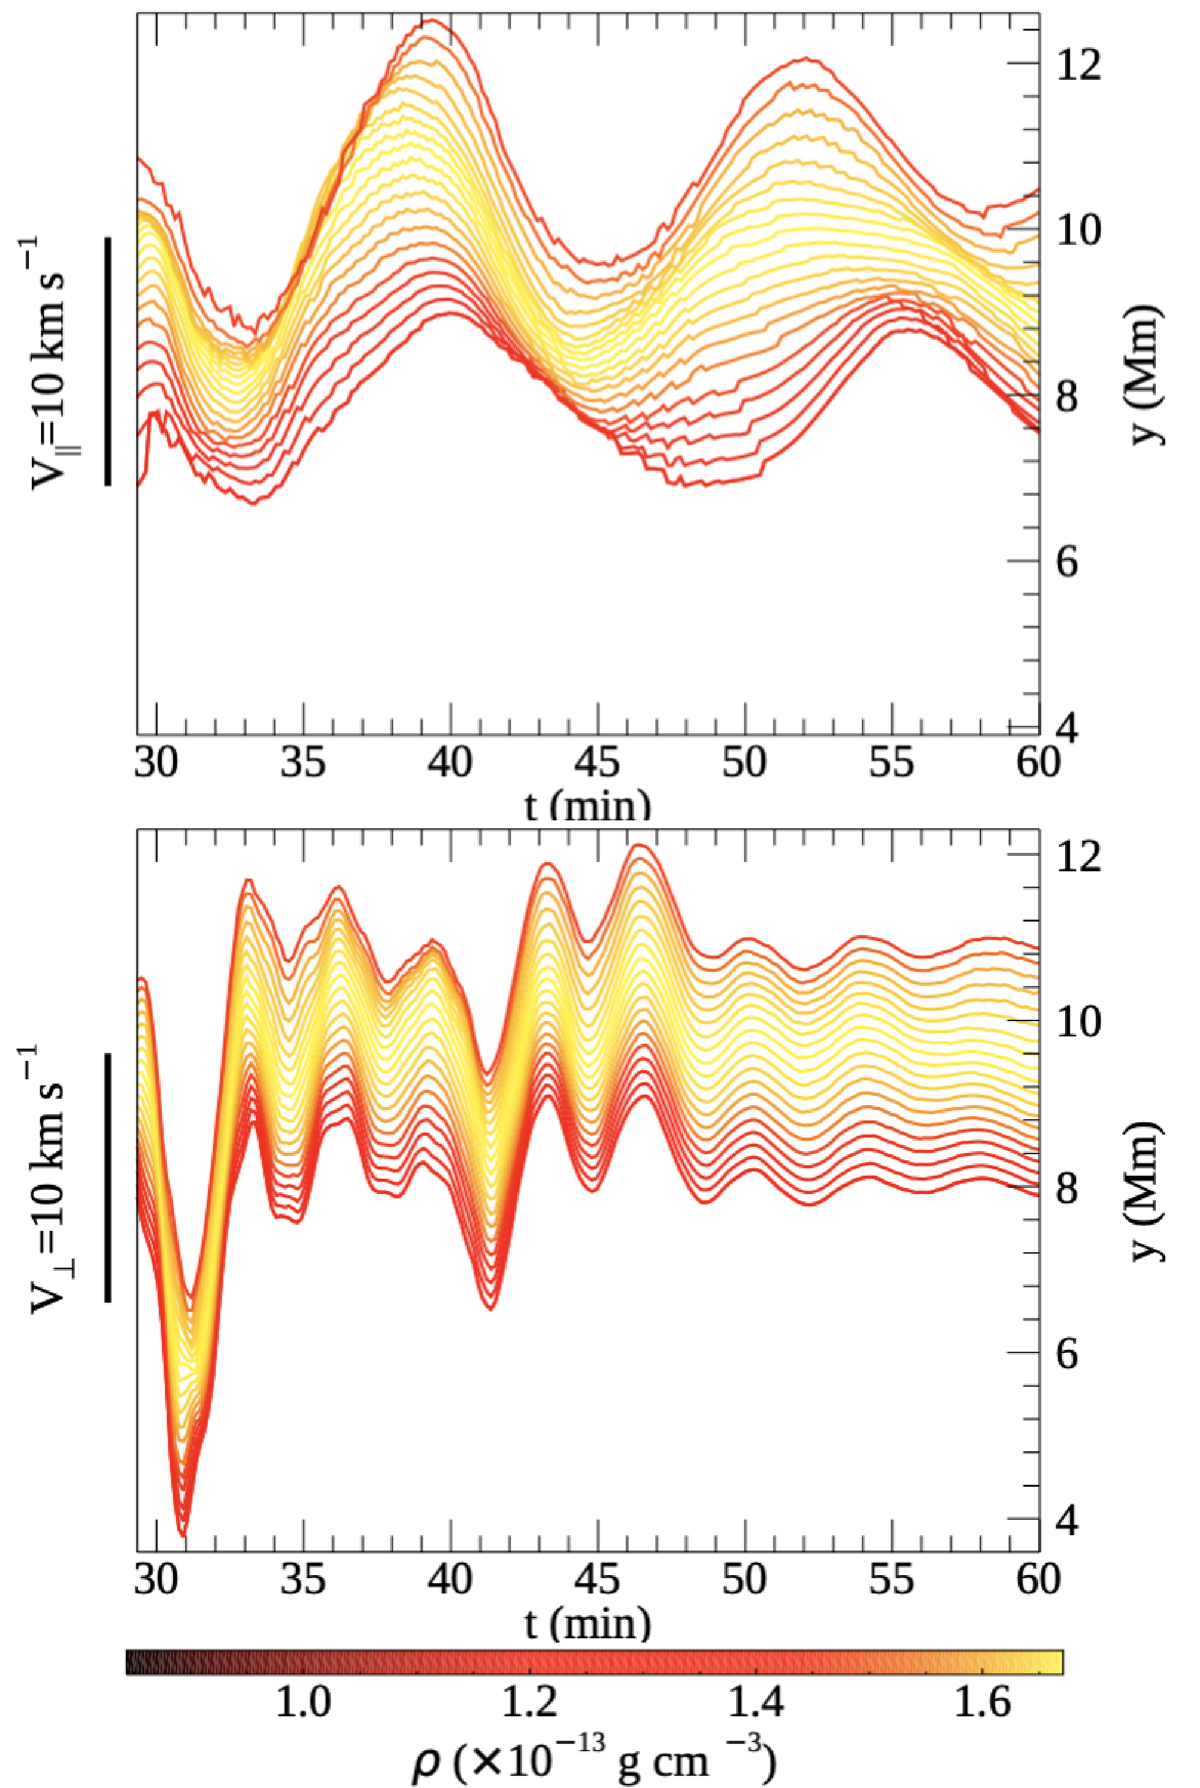
Fig. 16.
Download original image
Temporal evolution of v∥ (top) and v⊥ (bottom) obtained by tracking 20 fluid elements. The right vertical axis shows the initial height of the corresponding fluid element. The color bar corresponds to the initial density at the positions of the fluid elements.
Current usage metrics show cumulative count of Article Views (full-text article views including HTML views, PDF and ePub downloads, according to the available data) and Abstracts Views on Vision4Press platform.
Data correspond to usage on the plateform after 2015. The current usage metrics is available 48-96 hours after online publication and is updated daily on week days.
Initial download of the metrics may take a while.