Open Access
Fig. 12.
Download original image
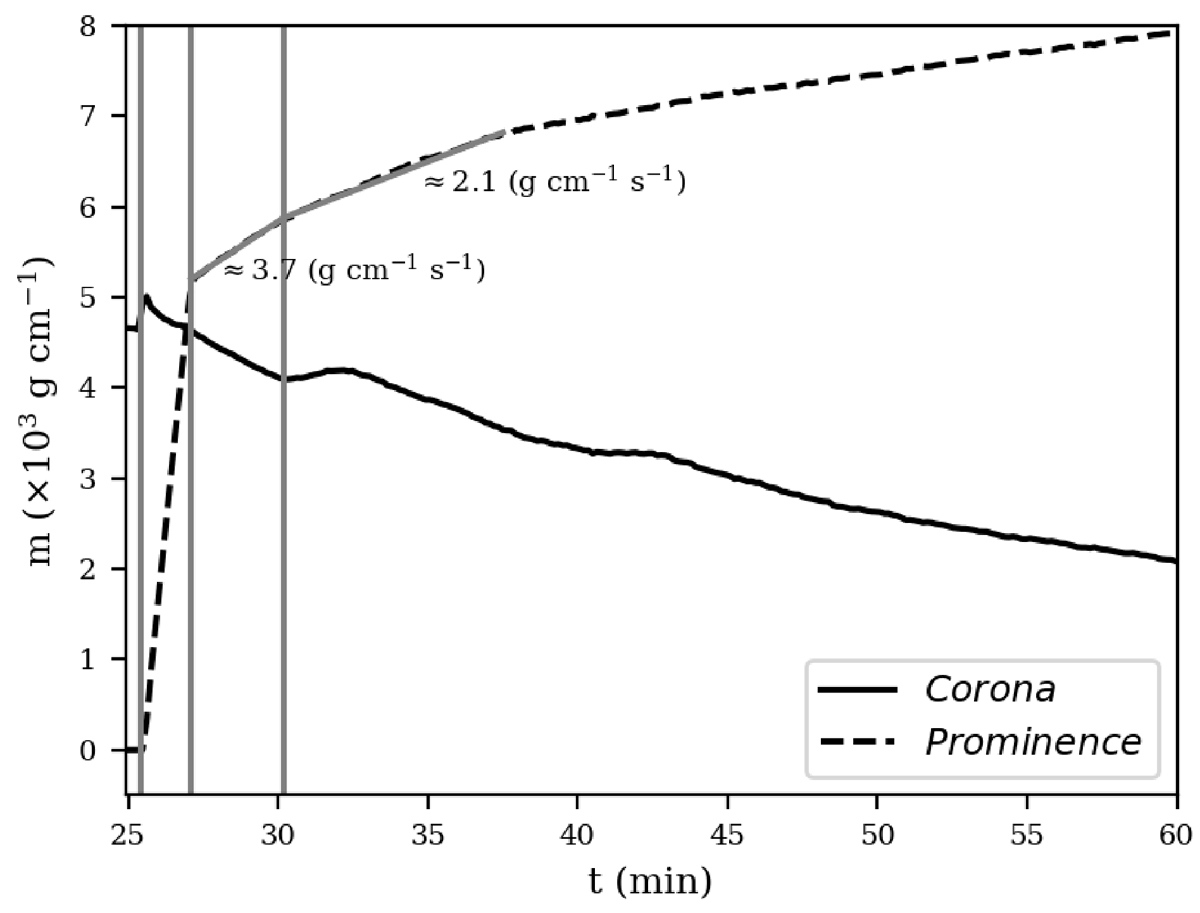
Temporal evolution of the total mass of the coronal and prominence plasma using the threshold, ρ = 10−14 g cm−3 in the dynamically evolving and tracked flux rope region. The vertical gray lines correspond to the activation and deactivation of mass loading and the arrival of the primary front.
Current usage metrics show cumulative count of Article Views (full-text article views including HTML views, PDF and ePub downloads, according to the available data) and Abstracts Views on Vision4Press platform.
Data correspond to usage on the plateform after 2015. The current usage metrics is available 48-96 hours after online publication and is updated daily on week days.
Initial download of the metrics may take a while.