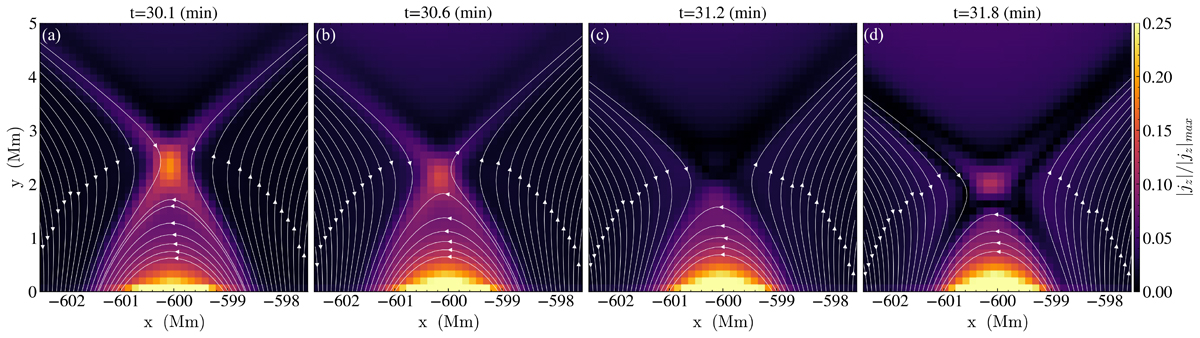
Fig. 11.
Download original image
Zoomed-in details of the wave front interaction with the remote flux rope, focused on the X-point below the prominence hosting flux rope. The temporal evolution of the current density, |jz|, is shown normalized to the instantaneous maximum value in the region, |jz|max, along with the magnetic field lines at the bottom of the flux rope after its interaction with the primary front. The white lines in each panel denote the instantaneous position of the same magnetic field lines. Animation 5 shows the temporal evolution in the time interval 28.6 − 50.1 minutes. An animation of this figure is available online.
Current usage metrics show cumulative count of Article Views (full-text article views including HTML views, PDF and ePub downloads, according to the available data) and Abstracts Views on Vision4Press platform.
Data correspond to usage on the plateform after 2015. The current usage metrics is available 48-96 hours after online publication and is updated daily on week days.
Initial download of the metrics may take a while.