Fig. 10.
Download original image
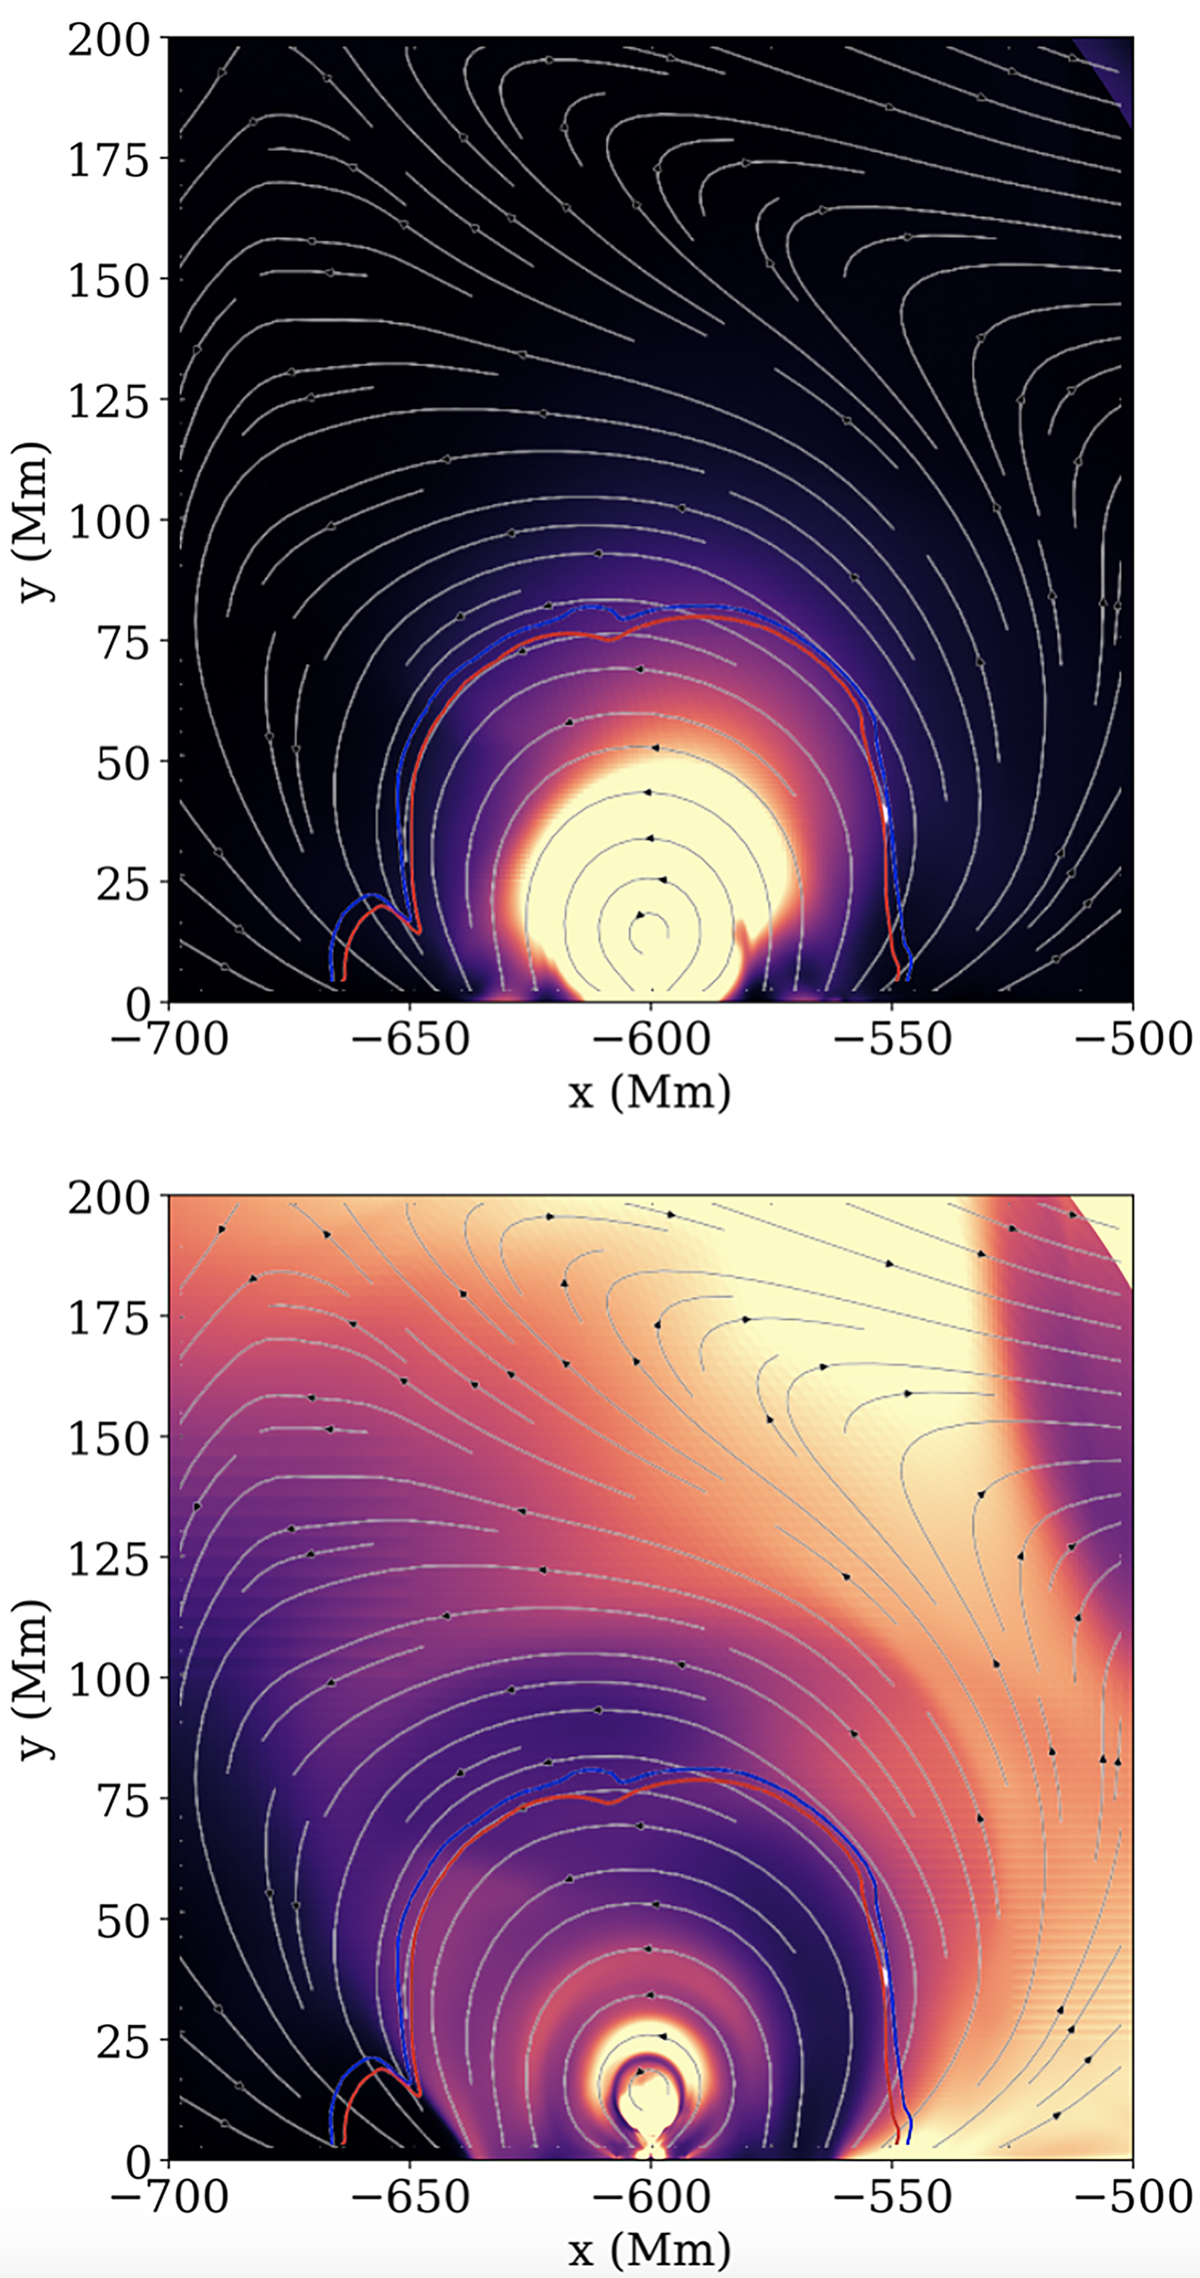
Magnetic (top) and acoustic (bottom) fluxes around the prominence region, averaged over time for the 20 − 40 minutes of the simulation. The gray lines depict the magnetic field lines at t = 40 minutes. The red and blue contours denote β ≈ 1 and vA ≈ cS at t = 40 minutes. The same saturation levels for the magnetic and acoustic fluxes are applied as in Fig. 7.
Current usage metrics show cumulative count of Article Views (full-text article views including HTML views, PDF and ePub downloads, according to the available data) and Abstracts Views on Vision4Press platform.
Data correspond to usage on the plateform after 2015. The current usage metrics is available 48-96 hours after online publication and is updated daily on week days.
Initial download of the metrics may take a while.