Fig. 7
Download original image
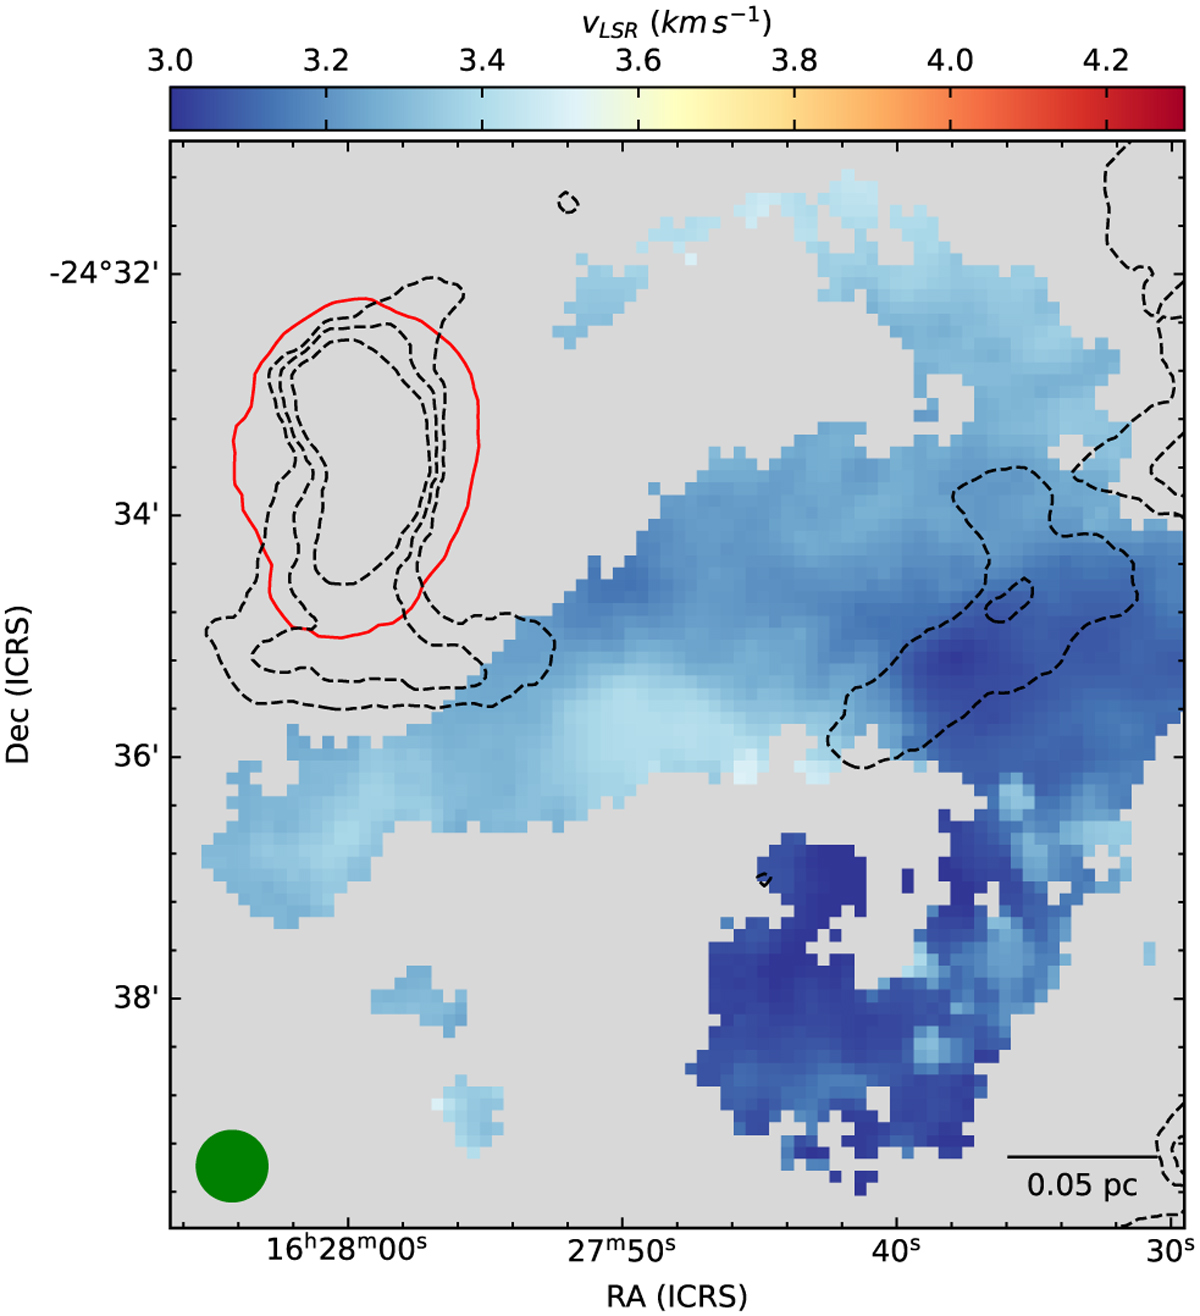
Velocity map of the narrow-blue component, with N(H2 ) obtained from Herschel observations overlaid as dashed black contours. The contour levels indicate N(H2) = 1.2 × 1022,1.3 × 1022,1.5 × 1022, 1.8 × 1022 cm−2. The red contour shows the boundary of the coherent core from single-component fits. The beam and scale bar are shown in the bottom left and the bottom right corners, respectively.
Current usage metrics show cumulative count of Article Views (full-text article views including HTML views, PDF and ePub downloads, according to the available data) and Abstracts Views on Vision4Press platform.
Data correspond to usage on the plateform after 2015. The current usage metrics is available 48-96 hours after online publication and is updated daily on week days.
Initial download of the metrics may take a while.