Fig. 6
Download original image
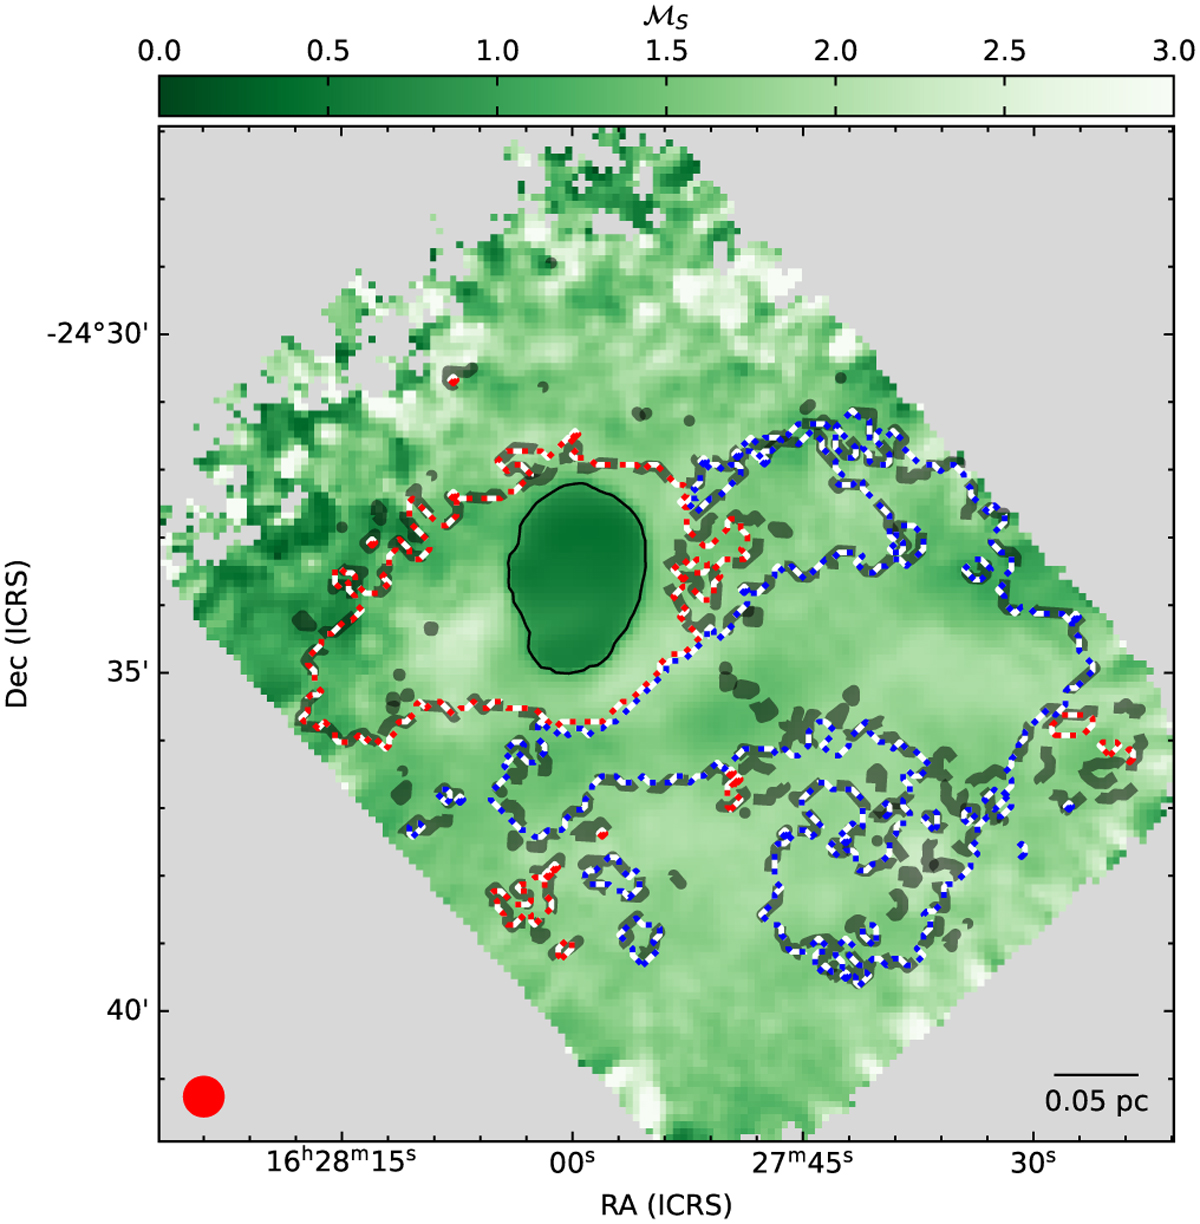
Sonic Mach number, calculated using a single-component fit. The solid black contour shows the boundary of the subsonic region in this map, which is similar to the previously determined boundary of the coherent dense core. The dashed black contour shows the boundary of the extended subsonic region that can only be detected using multicomponent analysis as described in this work. The dotted red and dotted blue contours show the extents of the narrow-red and narrow-blue components, respectively. The beam and scale bar are shown in the bottom left and the bottom right corners, respectively.
Current usage metrics show cumulative count of Article Views (full-text article views including HTML views, PDF and ePub downloads, according to the available data) and Abstracts Views on Vision4Press platform.
Data correspond to usage on the plateform after 2015. The current usage metrics is available 48-96 hours after online publication and is updated daily on week days.
Initial download of the metrics may take a while.