Fig. 5
Download original image
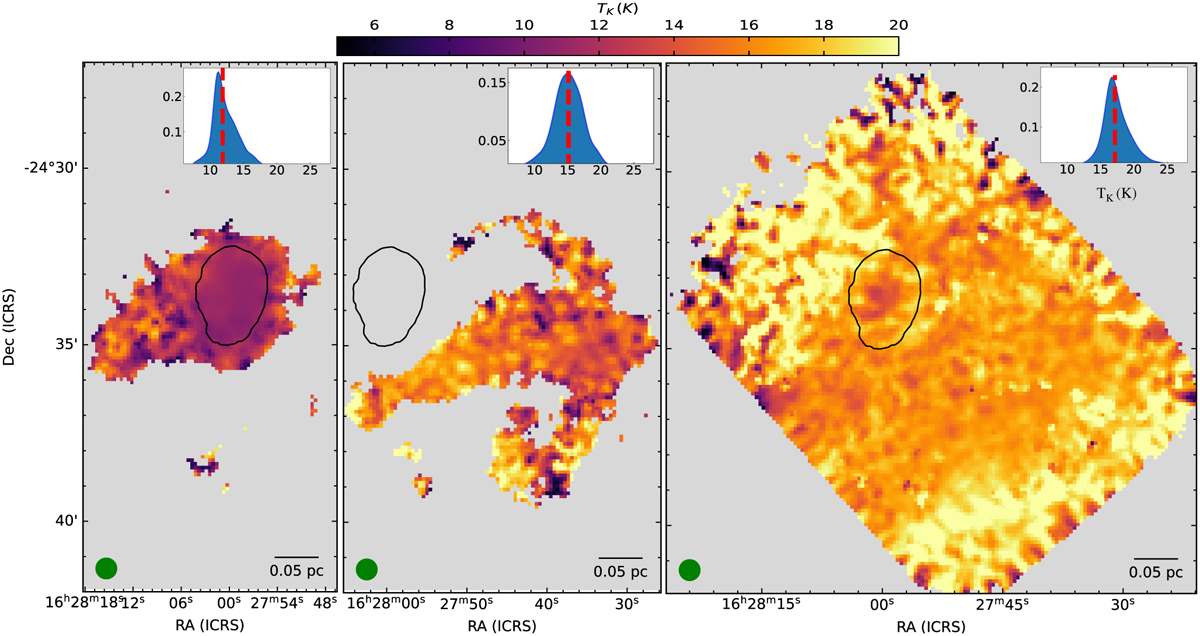
Kinetic temperature of the narrow-red (left), narrow-blue (middle), and broad (right) components. The common colour scale is shown at the top. The inset in the top right corner of each figure shows the probability distribution function of the temperature of the respective component. The vertical red lines in the insets show the median of that distribution. The narrow component is considerably cooler than the broad component throughout, especially in the vicinity of the coherent dense core, shown by the black contour. The blue-shifted part of the narrow component shows a slightly warmer temperature than the red-shifted counterpart. The solid black contour shows the boundary of the coherent core from singlecomponent fits. The beam and scale bar are shown in the bottom left and the bottom right corners, respectively.
Current usage metrics show cumulative count of Article Views (full-text article views including HTML views, PDF and ePub downloads, according to the available data) and Abstracts Views on Vision4Press platform.
Data correspond to usage on the plateform after 2015. The current usage metrics is available 48-96 hours after online publication and is updated daily on week days.
Initial download of the metrics may take a while.