Fig. 4
Download original image
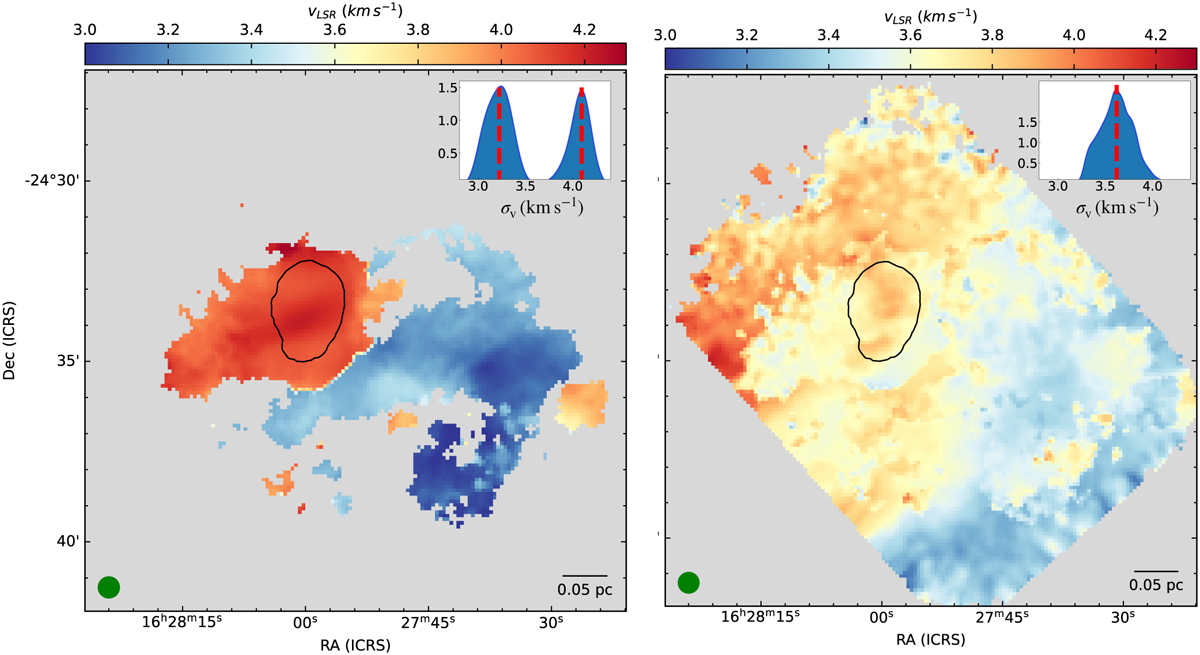
Velocities of the narrow (subsonic turbulence) component (left) and the broad (supersonic turbulence) component (right). The probability distribution function of the velocity of each component is shown in the insets in the top right corners of the figures. It can be seen that the narrow component is clearly further subdivided into two additional velocity components with median velocities of 3.23 km s−1 and 4.09 km s−1, while the broad component lies at a median velocity of 3.6 km s−1. (The median velocities of the different components are shown by the vertical red lines in the insets.) The solid black contour shows the boundary of the coherent core from single-component fits. The beam and scale bar are shown in the bottom left and the bottom right corners, respectively.
Current usage metrics show cumulative count of Article Views (full-text article views including HTML views, PDF and ePub downloads, according to the available data) and Abstracts Views on Vision4Press platform.
Data correspond to usage on the plateform after 2015. The current usage metrics is available 48-96 hours after online publication and is updated daily on week days.
Initial download of the metrics may take a while.