Fig. 3
Download original image
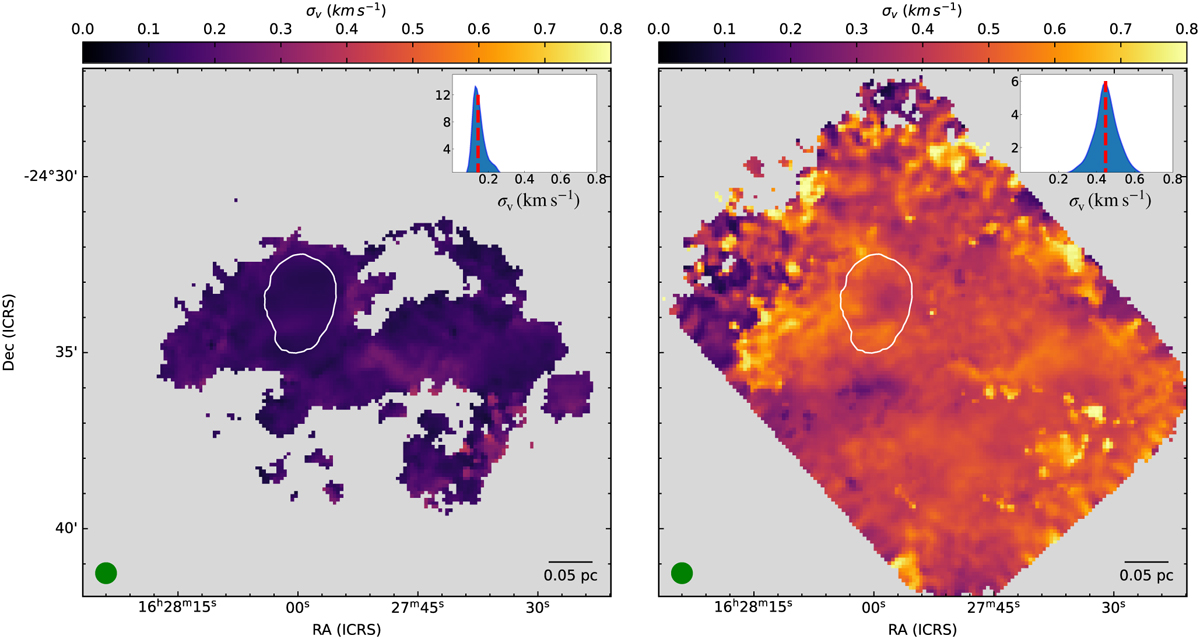
Velocity dispersions of the narrow component (left) and the broad component (right). The probability distribution function of the velocity dispersion of the respective component is shown in the inset in the top right corner of each figure. The vertical red lines in the insets show the median dispersion of each component. The turbulence in the narrow component is consistently subsonic throughout, whereas the broad component is always supersonic (the velocity dispersion for sonic turbulence at these temperatures is ≈0.2km s−1). The solid white contour shows the boundary of the coherent core from single-component fits. The beam and scale bar are shown in the bottom left and bottom right corners, respectively.
Current usage metrics show cumulative count of Article Views (full-text article views including HTML views, PDF and ePub downloads, according to the available data) and Abstracts Views on Vision4Press platform.
Data correspond to usage on the plateform after 2015. The current usage metrics is available 48-96 hours after online publication and is updated daily on week days.
Initial download of the metrics may take a while.