Fig. 3.
Download original image
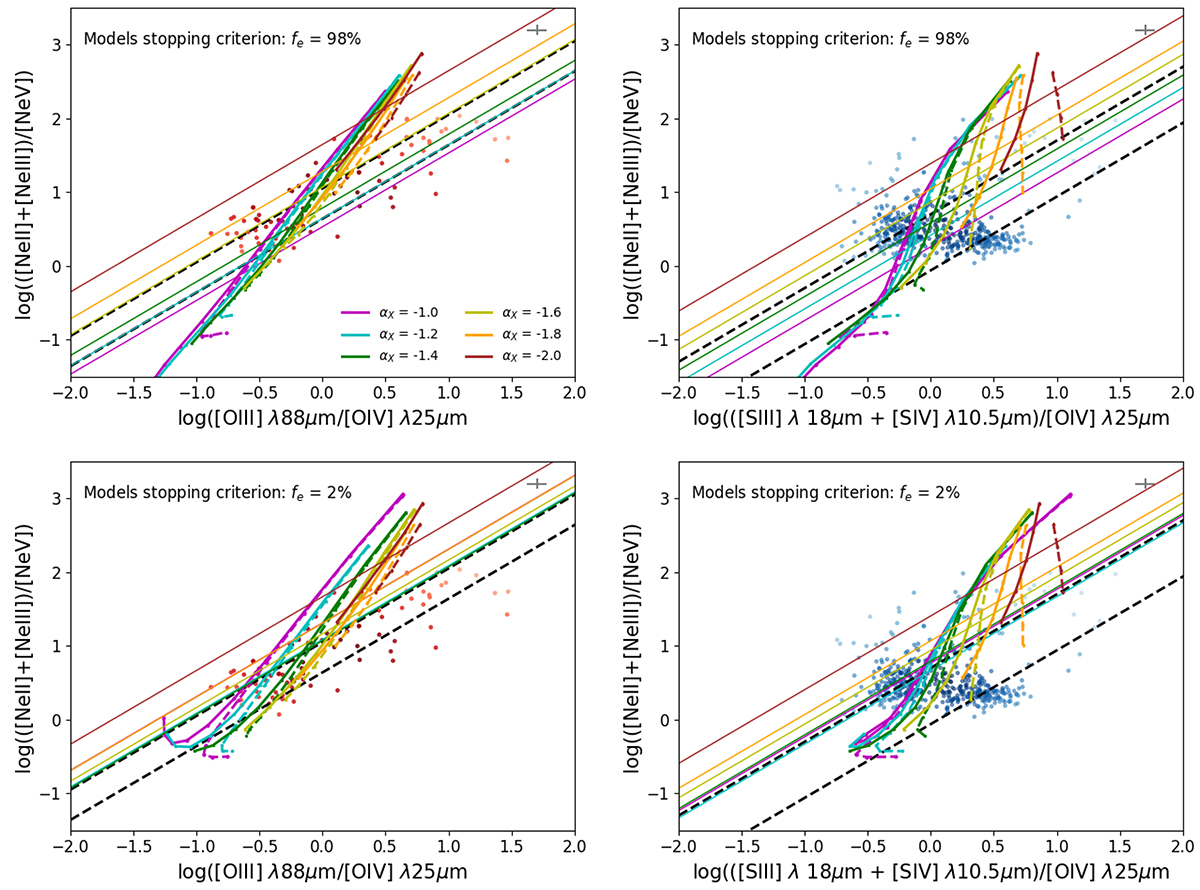
Two versions of the softness diagram based on IR lines for NLR in AGNs: ([Ne II]+[Ne III])/[Ne V] in relation to [O III]/[O IV] (left panels) and to ([S III]+[S IV])/[O IV] (right panels) for the compiled sample, represented as density points (red for the sample with [O III] and blue for [S III]+[S IV]), as compared with sequences of photoionization models. In all panels the thick colored lines represent models calculated for different values of αOX and connecting different values for log U from −0.5 in the lower left part of each sequence in steps of 0.25 dex. In the upper panels the stopping criterion of the models is that the fraction of free electrons is 98%, while in the lower panels is 2%. Solid lines in all panels represent models with dust grains, while dashed lines represent models without dust. The dashed black lines represent the average log η′ values obtained for the bimodal distributions obtained as described in Sect. 4. The mean η′ values for each model sequence are also represented as solid thin lines of the same color (only shown for models with dust grains). In the upper right part of all panels, the cross indicates the typical observational errors for the represented sample.
Current usage metrics show cumulative count of Article Views (full-text article views including HTML views, PDF and ePub downloads, according to the available data) and Abstracts Views on Vision4Press platform.
Data correspond to usage on the plateform after 2015. The current usage metrics is available 48-96 hours after online publication and is updated daily on week days.
Initial download of the metrics may take a while.