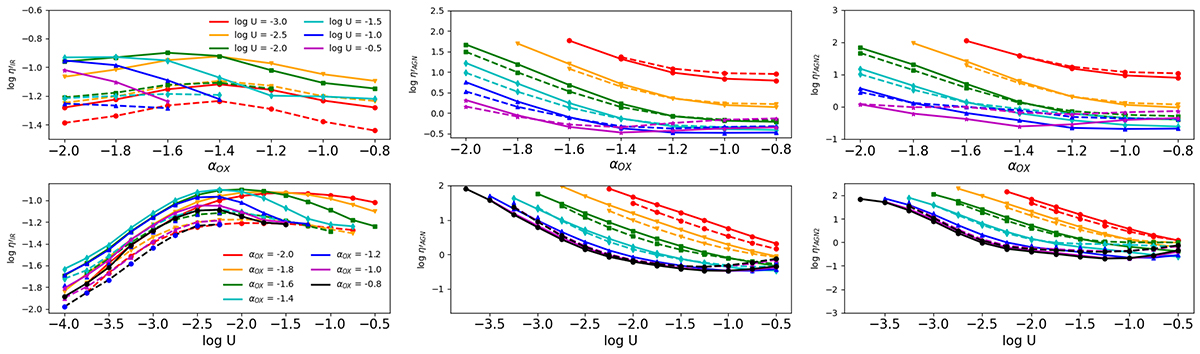
Fig. 2.
Download original image
Variation predicted by different sequences of photoionization models of log η′IR (left panels), log η′AGN (middle panels), and log η′AGN2 (right panels) as a function of the parameter αOX (upper panels) and log U (lower panels). The models represented here were calculated with a stopping criterion when the fraction of free electrons is 98%. In all panels the solid lines represent models calculated with 12 + log(O/H) = 9.0, while dashed lines assume a value of 8.1.
Current usage metrics show cumulative count of Article Views (full-text article views including HTML views, PDF and ePub downloads, according to the available data) and Abstracts Views on Vision4Press platform.
Data correspond to usage on the plateform after 2015. The current usage metrics is available 48-96 hours after online publication and is updated daily on week days.
Initial download of the metrics may take a while.