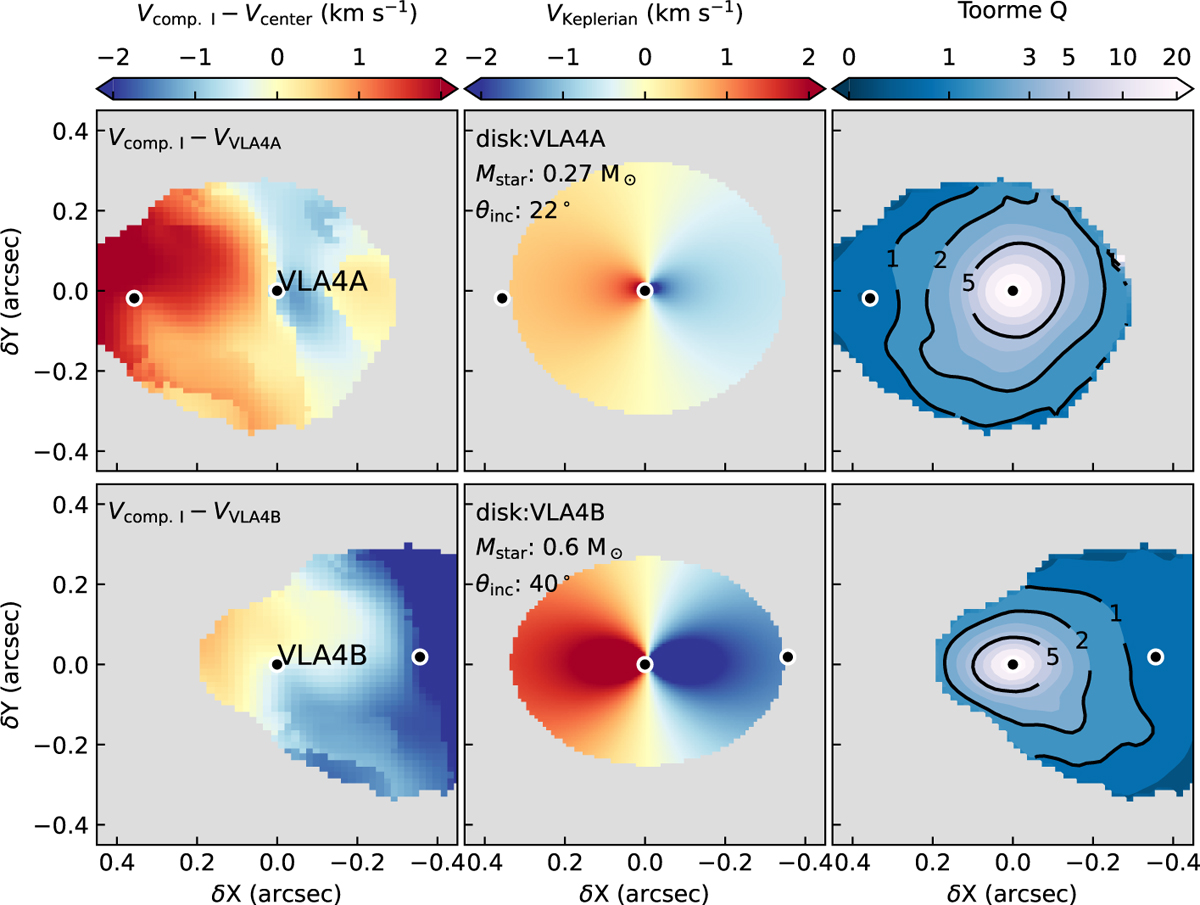
Fig. 9
Download original image
Left column: velocity map of component I (Fig. 8) relative to VLA4A (top, VVLA4A = 7.36 km s−1) and VLA4B (bottom, VVLA4B = 9.33 km s−1). Middle: Keplerian disk model using the Mstar and θinc from Diaz-Rodriguez et al. (2022). We note that the inclination angle of VLA4B is from the dust continuum as the gas disk is not seen here. Right: Toomre Q map derived using the physical parameters from CH3CN plus models of rotation from the middle panel.
Current usage metrics show cumulative count of Article Views (full-text article views including HTML views, PDF and ePub downloads, according to the available data) and Abstracts Views on Vision4Press platform.
Data correspond to usage on the plateform after 2015. The current usage metrics is available 48-96 hours after online publication and is updated daily on week days.
Initial download of the metrics may take a while.