Fig. 4
Download original image
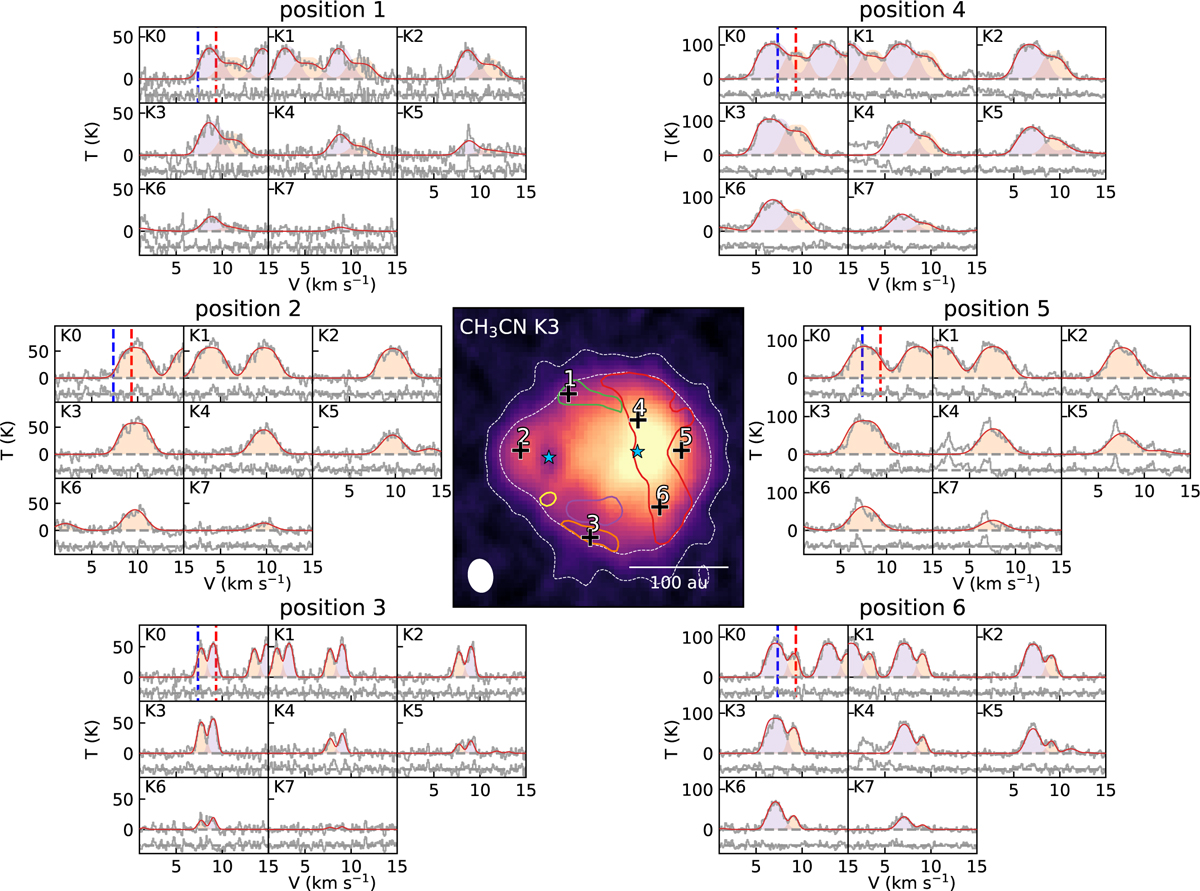
Spectra of CH3CN toward SVS13A at selected positions marked in the central image of the K=3 integrated intensity map. In the central image, the white contours represent the S/N of 3 and 12, as the latter represents the region where LTE fitting is made. The blue stars indicate the positions of VLA4A and VLA4B. The kinematic components II-VI (II: red, III: green, IV: orange, V:purple, VI: yellow; see Fig. 6) are shown as contours in different colors and for the positions within a contour, the two-layer LTE model is used for fitting (see Sect. 4.3). Each spectrum has been divided to eight individual panels centering at the Vlsr, i.e., 7.36 km s−1 for VLA4A and 9.33 km s−1 for VLA4B (Diaz-Rodriguez et al. 2022 blue and red dashed vertical lines in the K=0 panel), of the K-ladder. The red spectra show the best-fit from the LTE model while the color areas show the two-layer model with front (1, orange) and rear (2, purple) layers. We note that Eq. (2) is more complicated, so this colored area is only meant to offer an general view of Vlsr and ∆V.
Current usage metrics show cumulative count of Article Views (full-text article views including HTML views, PDF and ePub downloads, according to the available data) and Abstracts Views on Vision4Press platform.
Data correspond to usage on the plateform after 2015. The current usage metrics is available 48-96 hours after online publication and is updated daily on week days.
Initial download of the metrics may take a while.