Fig. 9.
Download original image
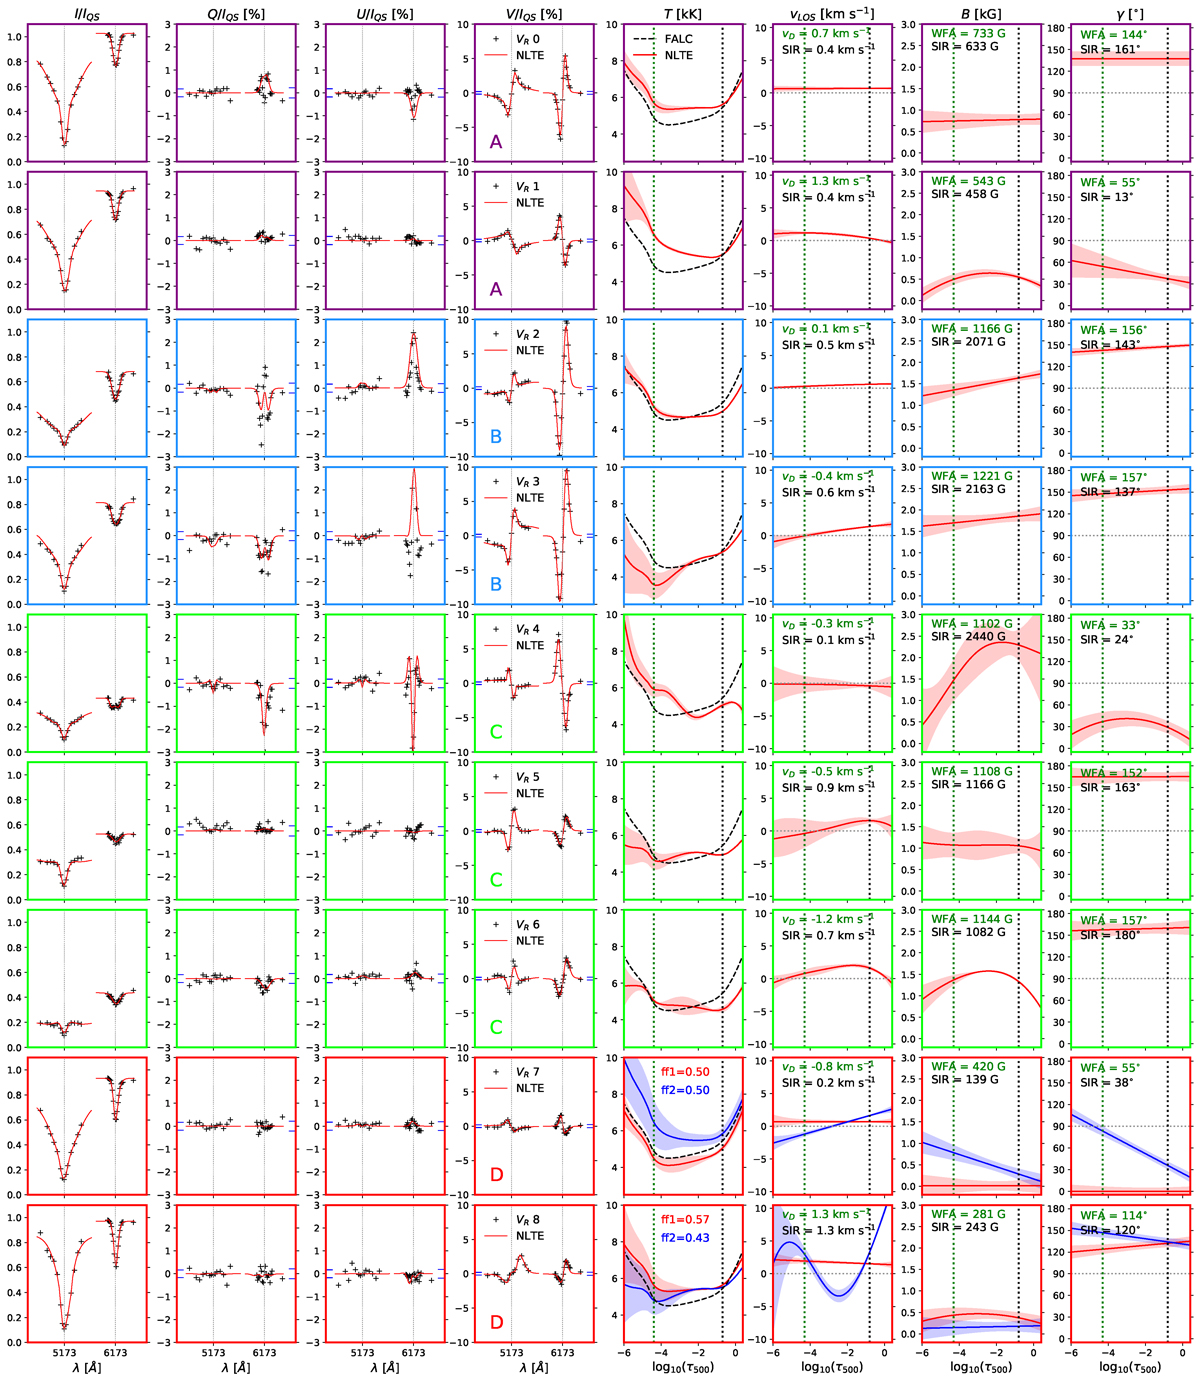
NLTE inversions of Stokes V representatives. From left to right: Observed Stokes profiles (black markers) in the pair of Mg I 5163 and Fe I 6173 lines normalized to their mean QS continuum intensity (the Mg continuum intensity was estimated from the FTS atlas profile), and their best fits (red lines). The blue tick-marks in the Q/IQS, U/IQS, and V/IQS panels indicate the σ levels for each spectral line. The resulting temperature stratifications are shown in the fifth column (red lines), overlaid on the initial FALC model (black dashed line), followed by the retrieved LOS velocity, magnetic field intensity, and magnetic field inclination. The blue lines in the last two rows show the stratifications for a second atmospheric component, with filling factors ff indicated in the temperature panel. The uncertainties are indicated by the shaded areas. For comparison, labels in the last three columns indicate the results obtained with the classical methods. Vertical green and black dotted lines in the panels of T, vLOS, B, and γ indicate the height of maximum response to changes in the given parameter within the Mg and Fe lines core, respectively, according to the response functions displayed in Figure A.1 (these heights are only valid for VR 0, but are shown as a reference for all representative profiles). Letters in column 4 and frame colors highlight the different families.
Current usage metrics show cumulative count of Article Views (full-text article views including HTML views, PDF and ePub downloads, according to the available data) and Abstracts Views on Vision4Press platform.
Data correspond to usage on the plateform after 2015. The current usage metrics is available 48-96 hours after online publication and is updated daily on week days.
Initial download of the metrics may take a while.